Who can use this feature
- Read-only Company Admins
- Read-only Network Admins
Overview
This article serves as a guide for the Switches section in the Dashboard for non-operators of the network (viewers).
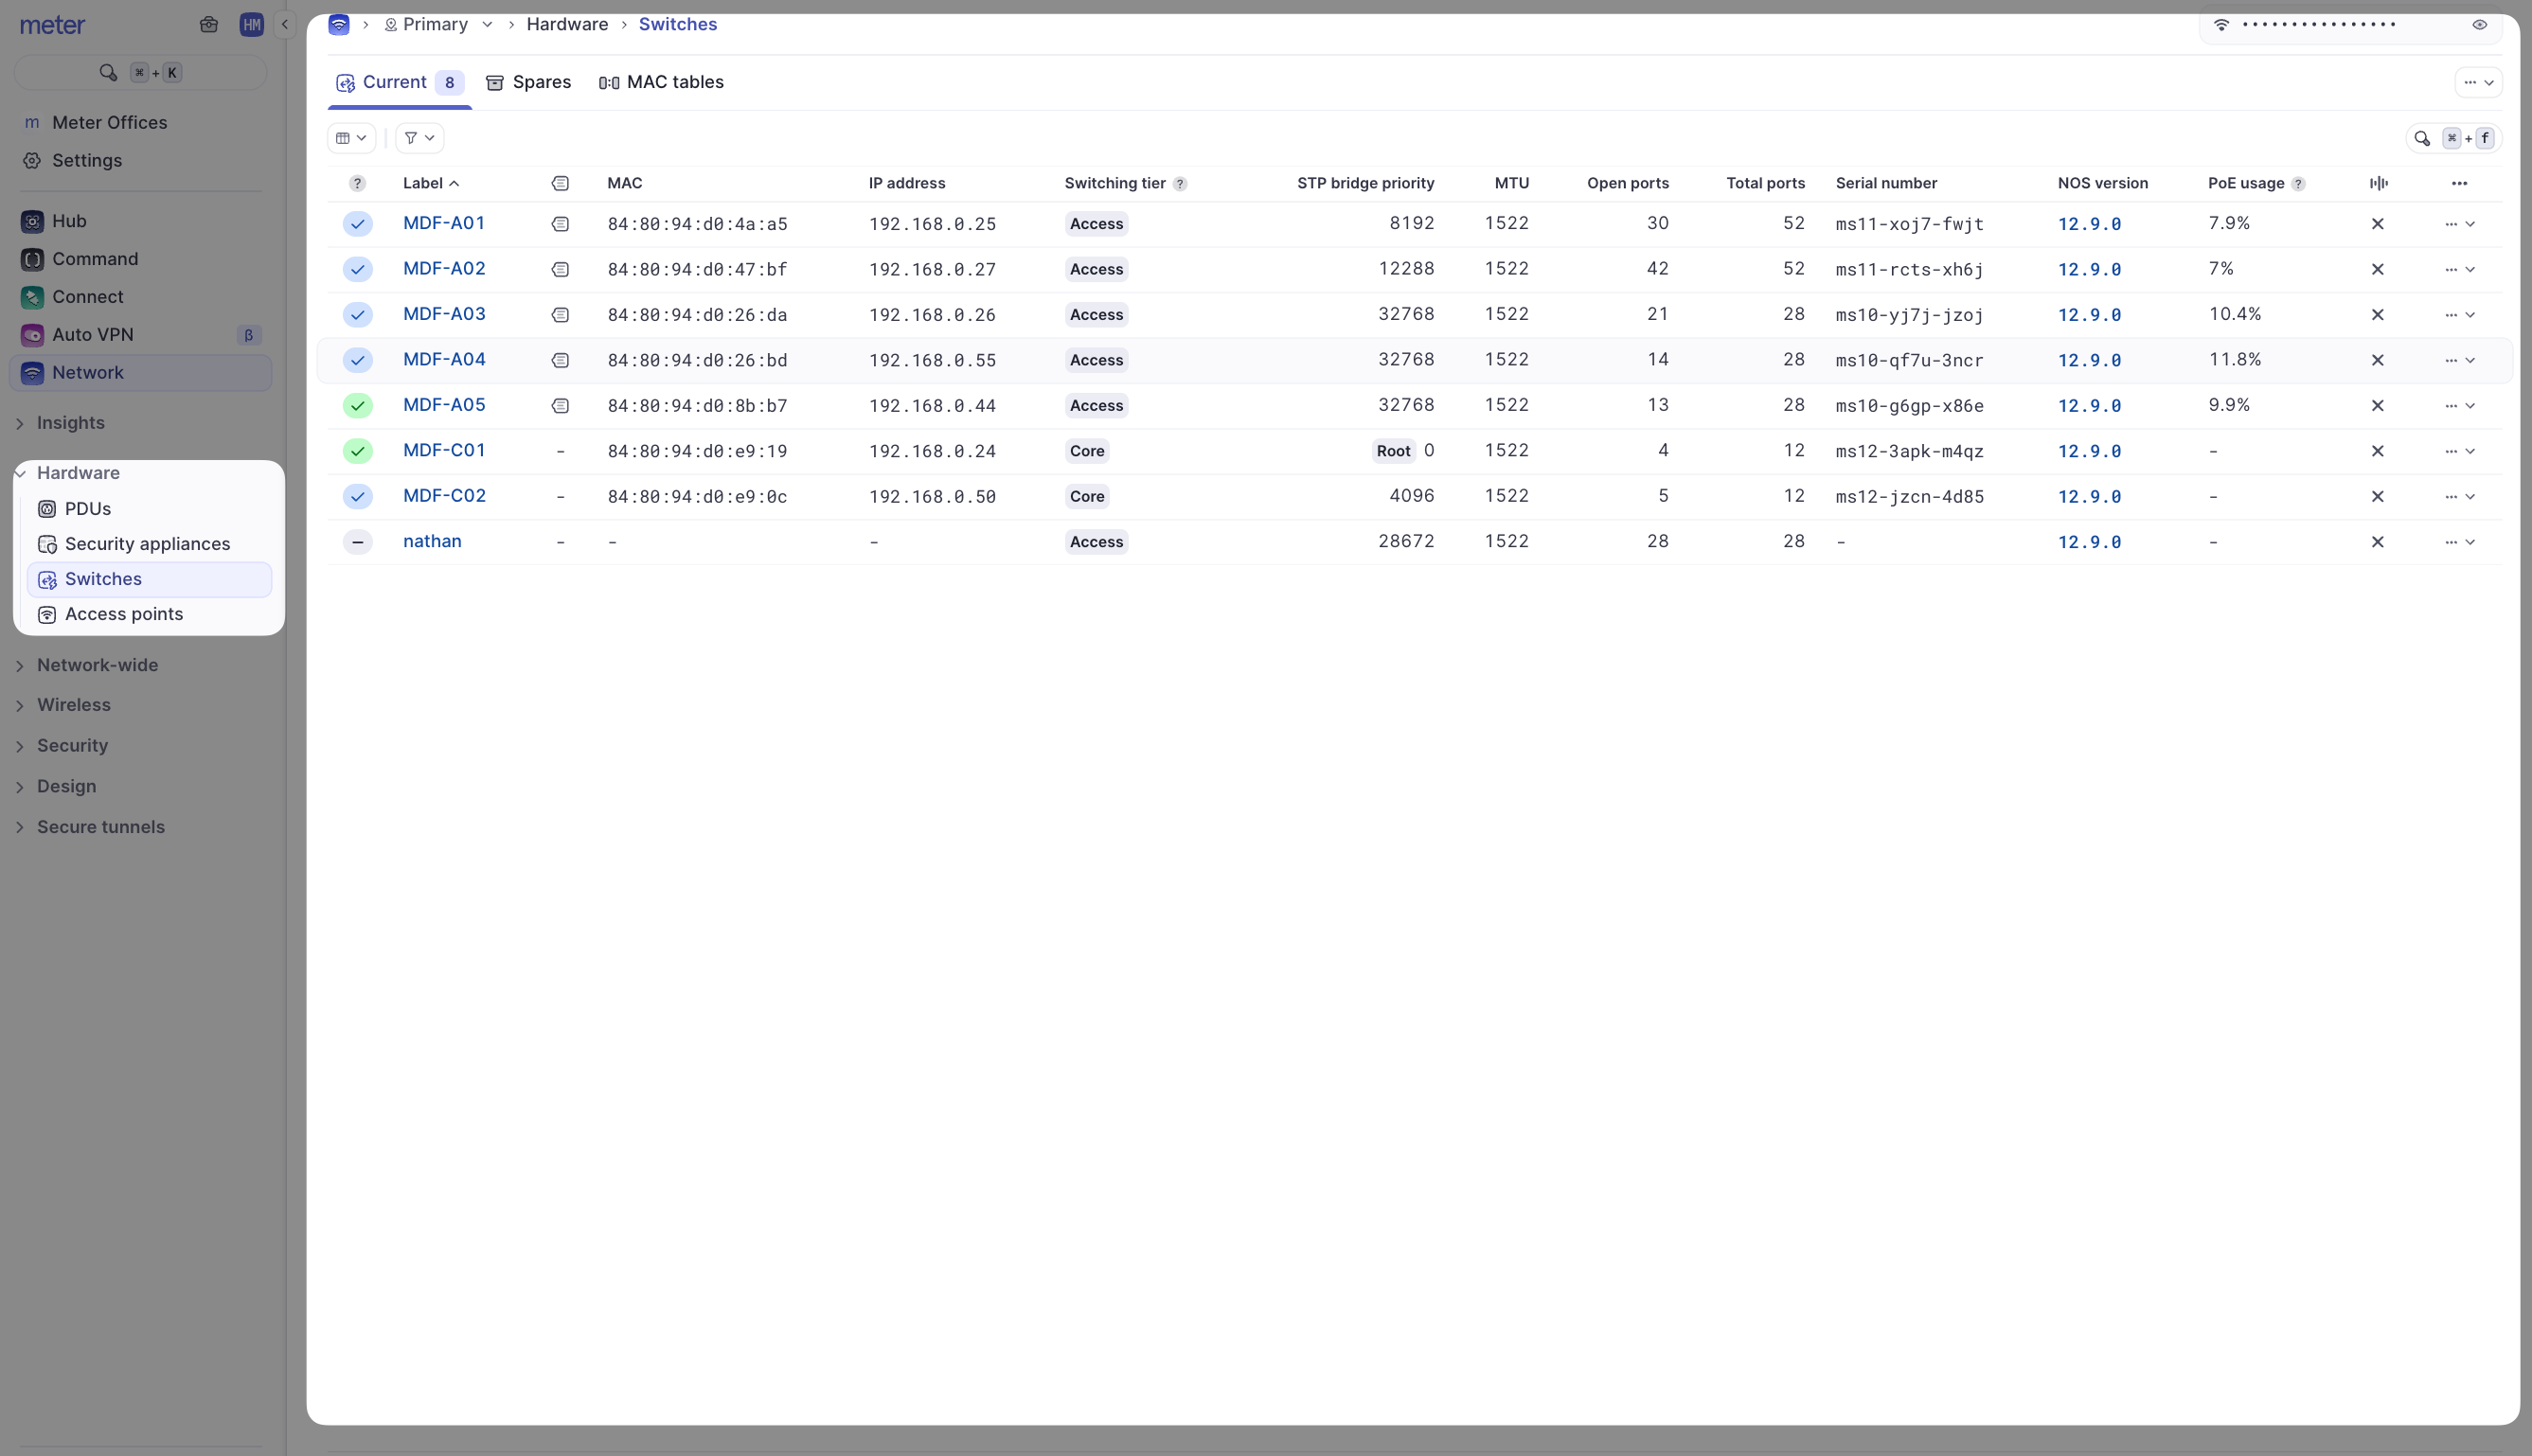
To view switches on your network, click on the Switches tab on the left-hand side menu.
- Log in at dashboard.meter.com
- Navigate to Switches
- The switch Label or name. Typically switches will have a physical label on them in the field with this name
- The MAC address of the switch
- The current IP address of the switch
- The switching tier level
- STP bridge priority setting. These values will be set by your network operators or Meter. If the switch is currently the Root bridge it will be marked as such
- Open ports - The number of ports that are currently not in use on the switch
- Search bar - Use this to find a switch if you know the label
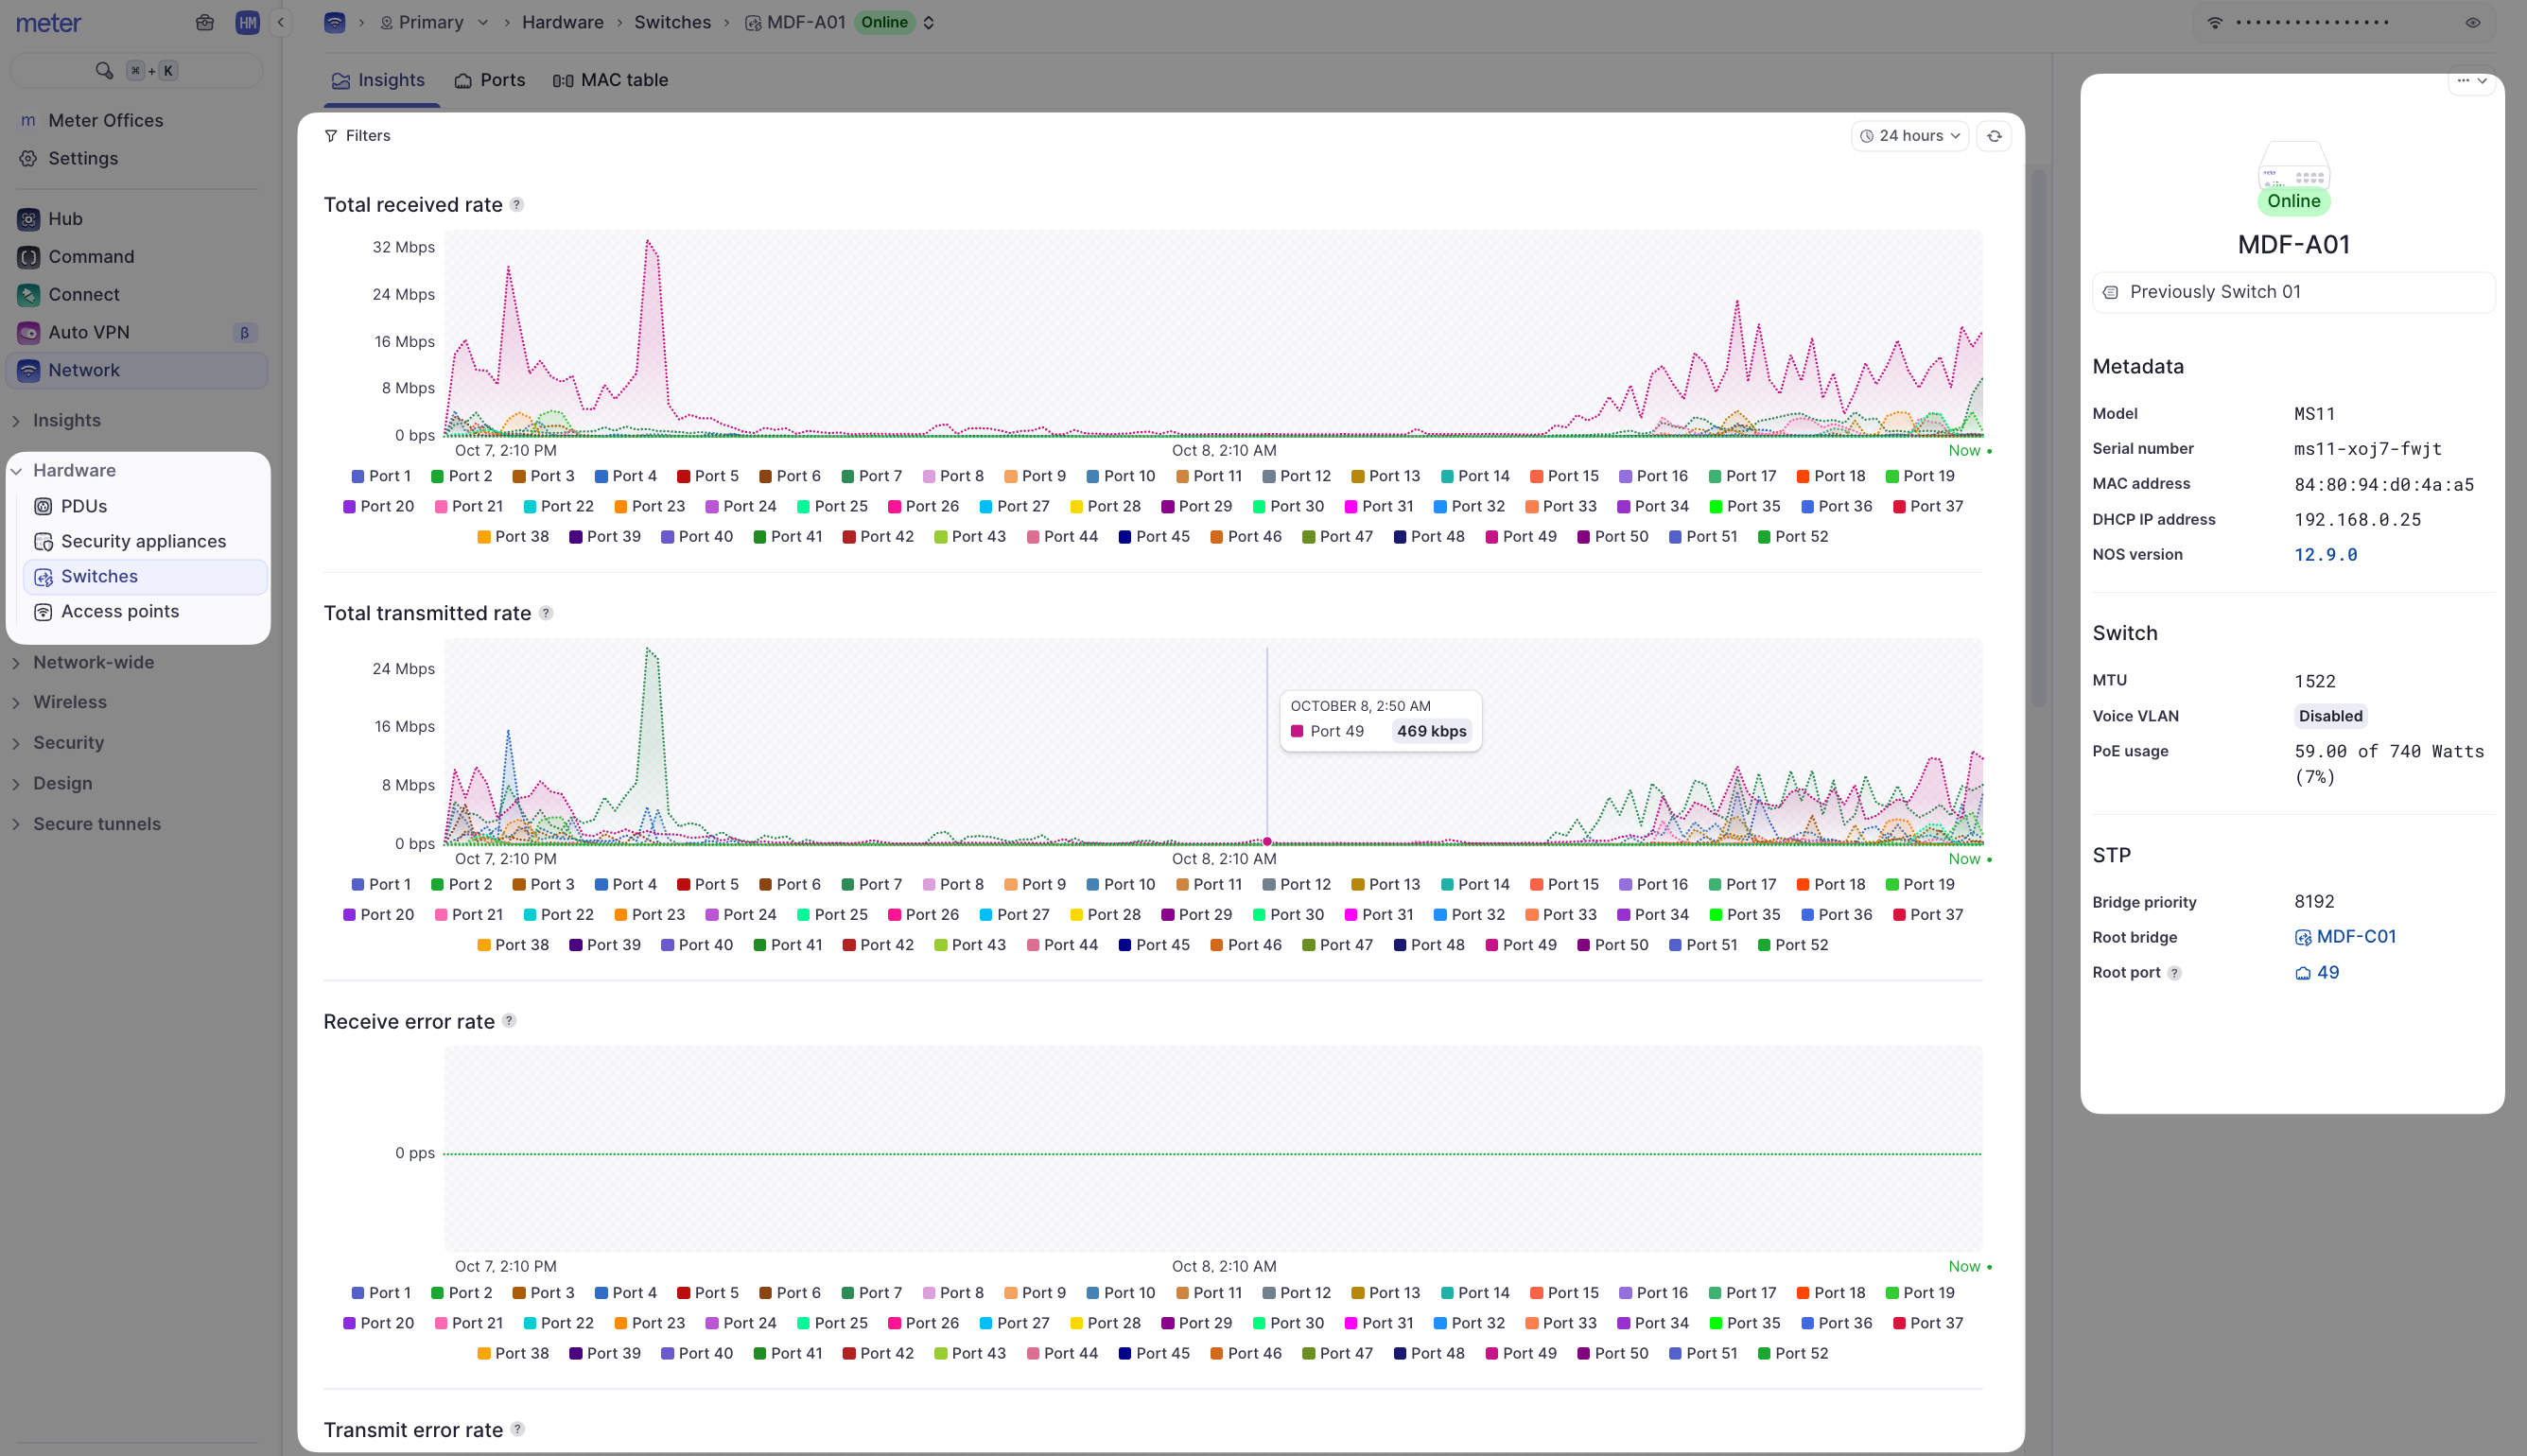
To view more details on a switch, click on the switch Label. This will take you to the switch's Insight page.
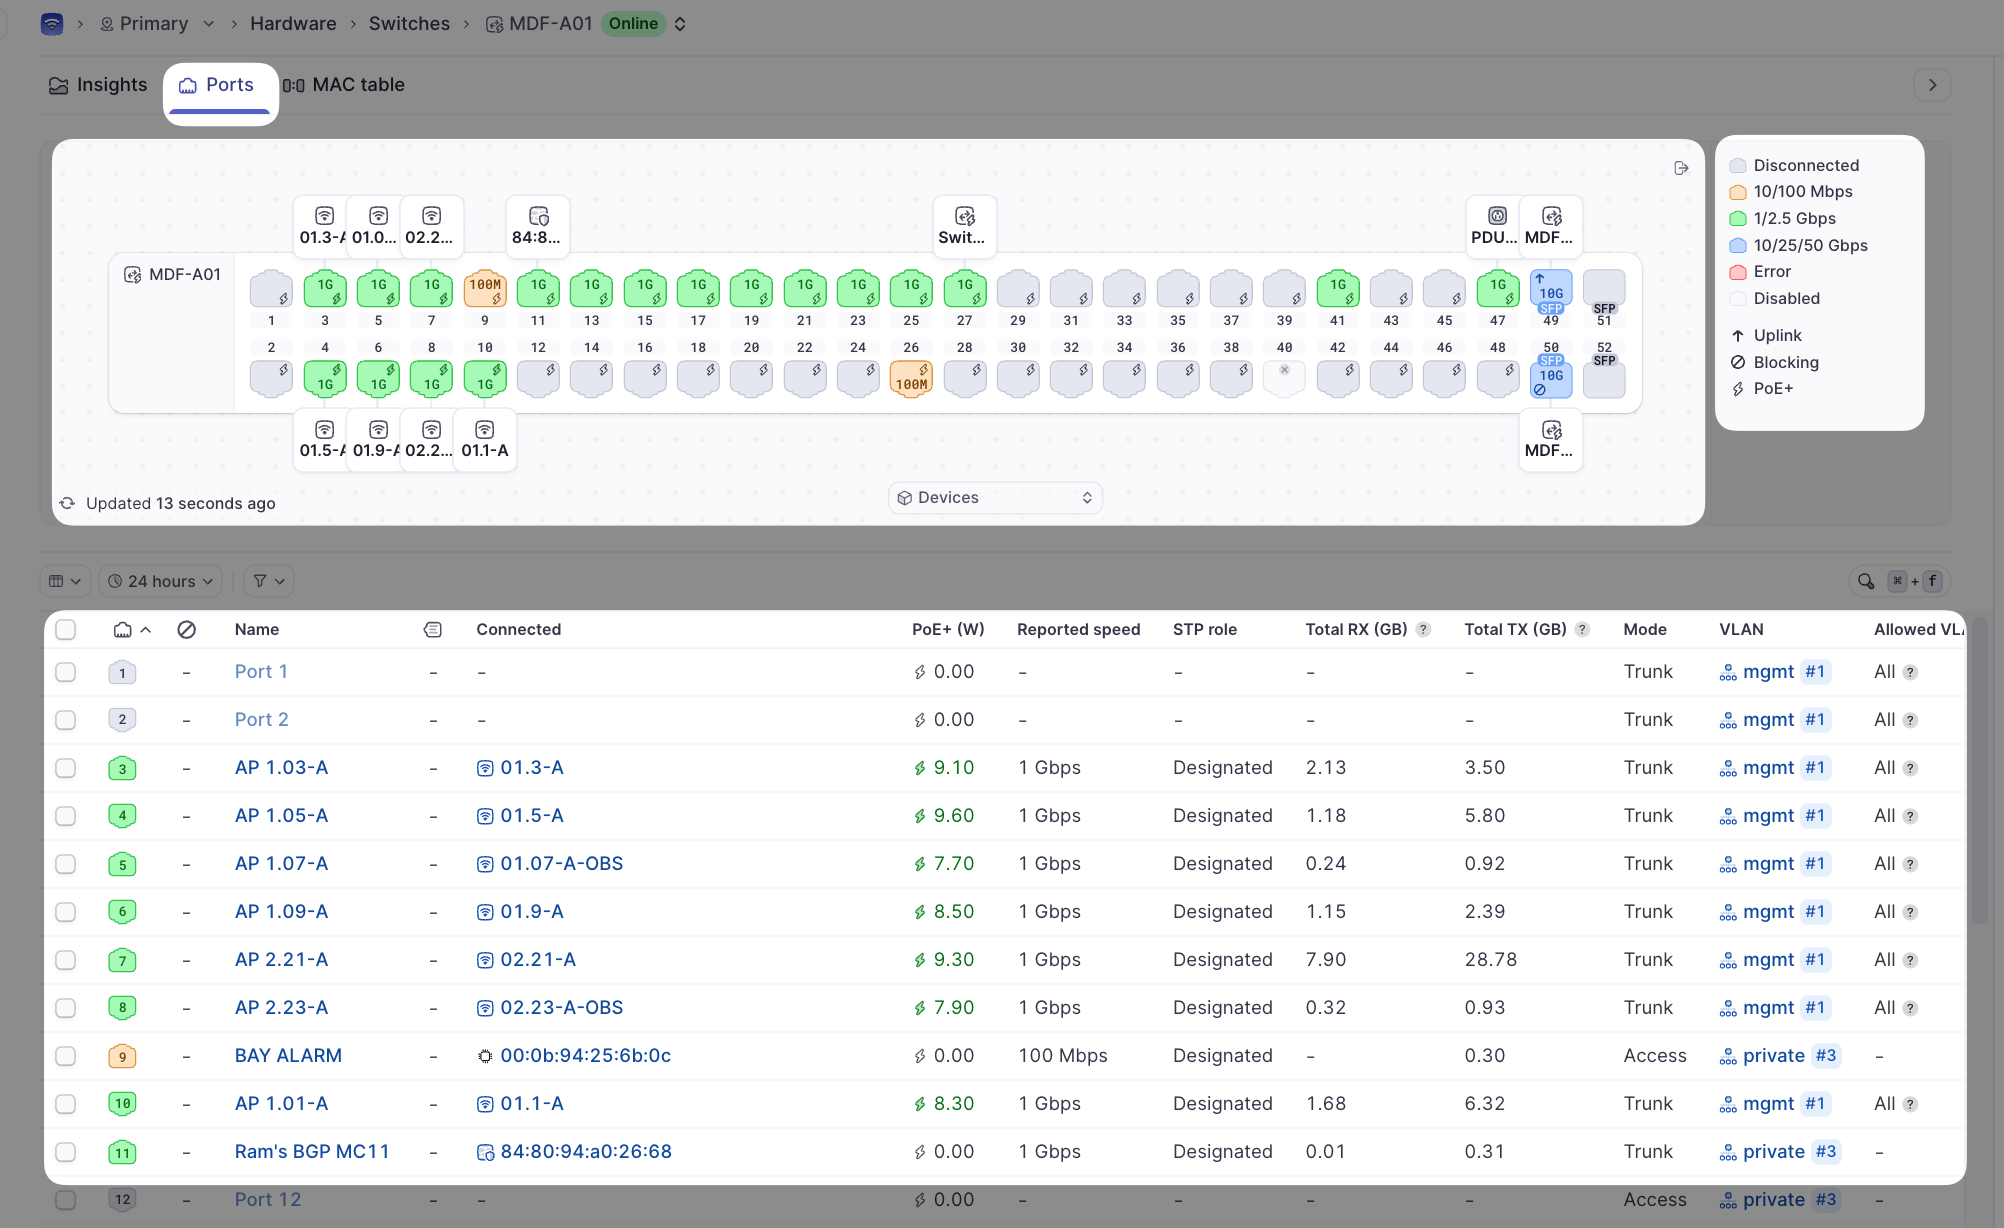
Ports
The Ports page will show an overview of all active and inactive ports.
| Column | Description |
|---|---|
| Name | A label typically used to denote what is connected to a particular switch port |
| Connected | Shows the host name of any Meter devices connected to the port; or the MAC address if it is a non-Meter device |
| PoE+(W) | Shows the current power draw if a PoE device is connected to the port |
| Reported Speed | Current link speed |
| STP Role | Current port role for STP |
| Total RX / Total TX | Amount of data sent or transmitted on a port over the past 24 hours |
| Mode | Shows if a port is currently set to Access or Trunk |
| VLAN | Shows the native VLAN of the port |
| Allowed VLAN IDs | Shows which VLANs would be trunked through a trunk port |
| Search Bar | Can be used to search for connected devices (name/MAC) |
| Switch Selection | Can be used to change between switches ports/insights quickly |
| Key1 | Ports will be highlighted in the colors noted here to show link speed or state (error/disconnected/disabled). If a port shows disabled or in error, please contact your Network Operator or Meter Support |
| Key2 | Special port statuses. "Uplink" refers to the port that is connected to the Meter Firewall. "Blocking" indicates that STP is currently in a blocking state on the port. "PoE+" indicates that the connected device is currently drawing PoE from the switch |
Clicking on a port name will expose more port-specific options on the right-hand-side menu.
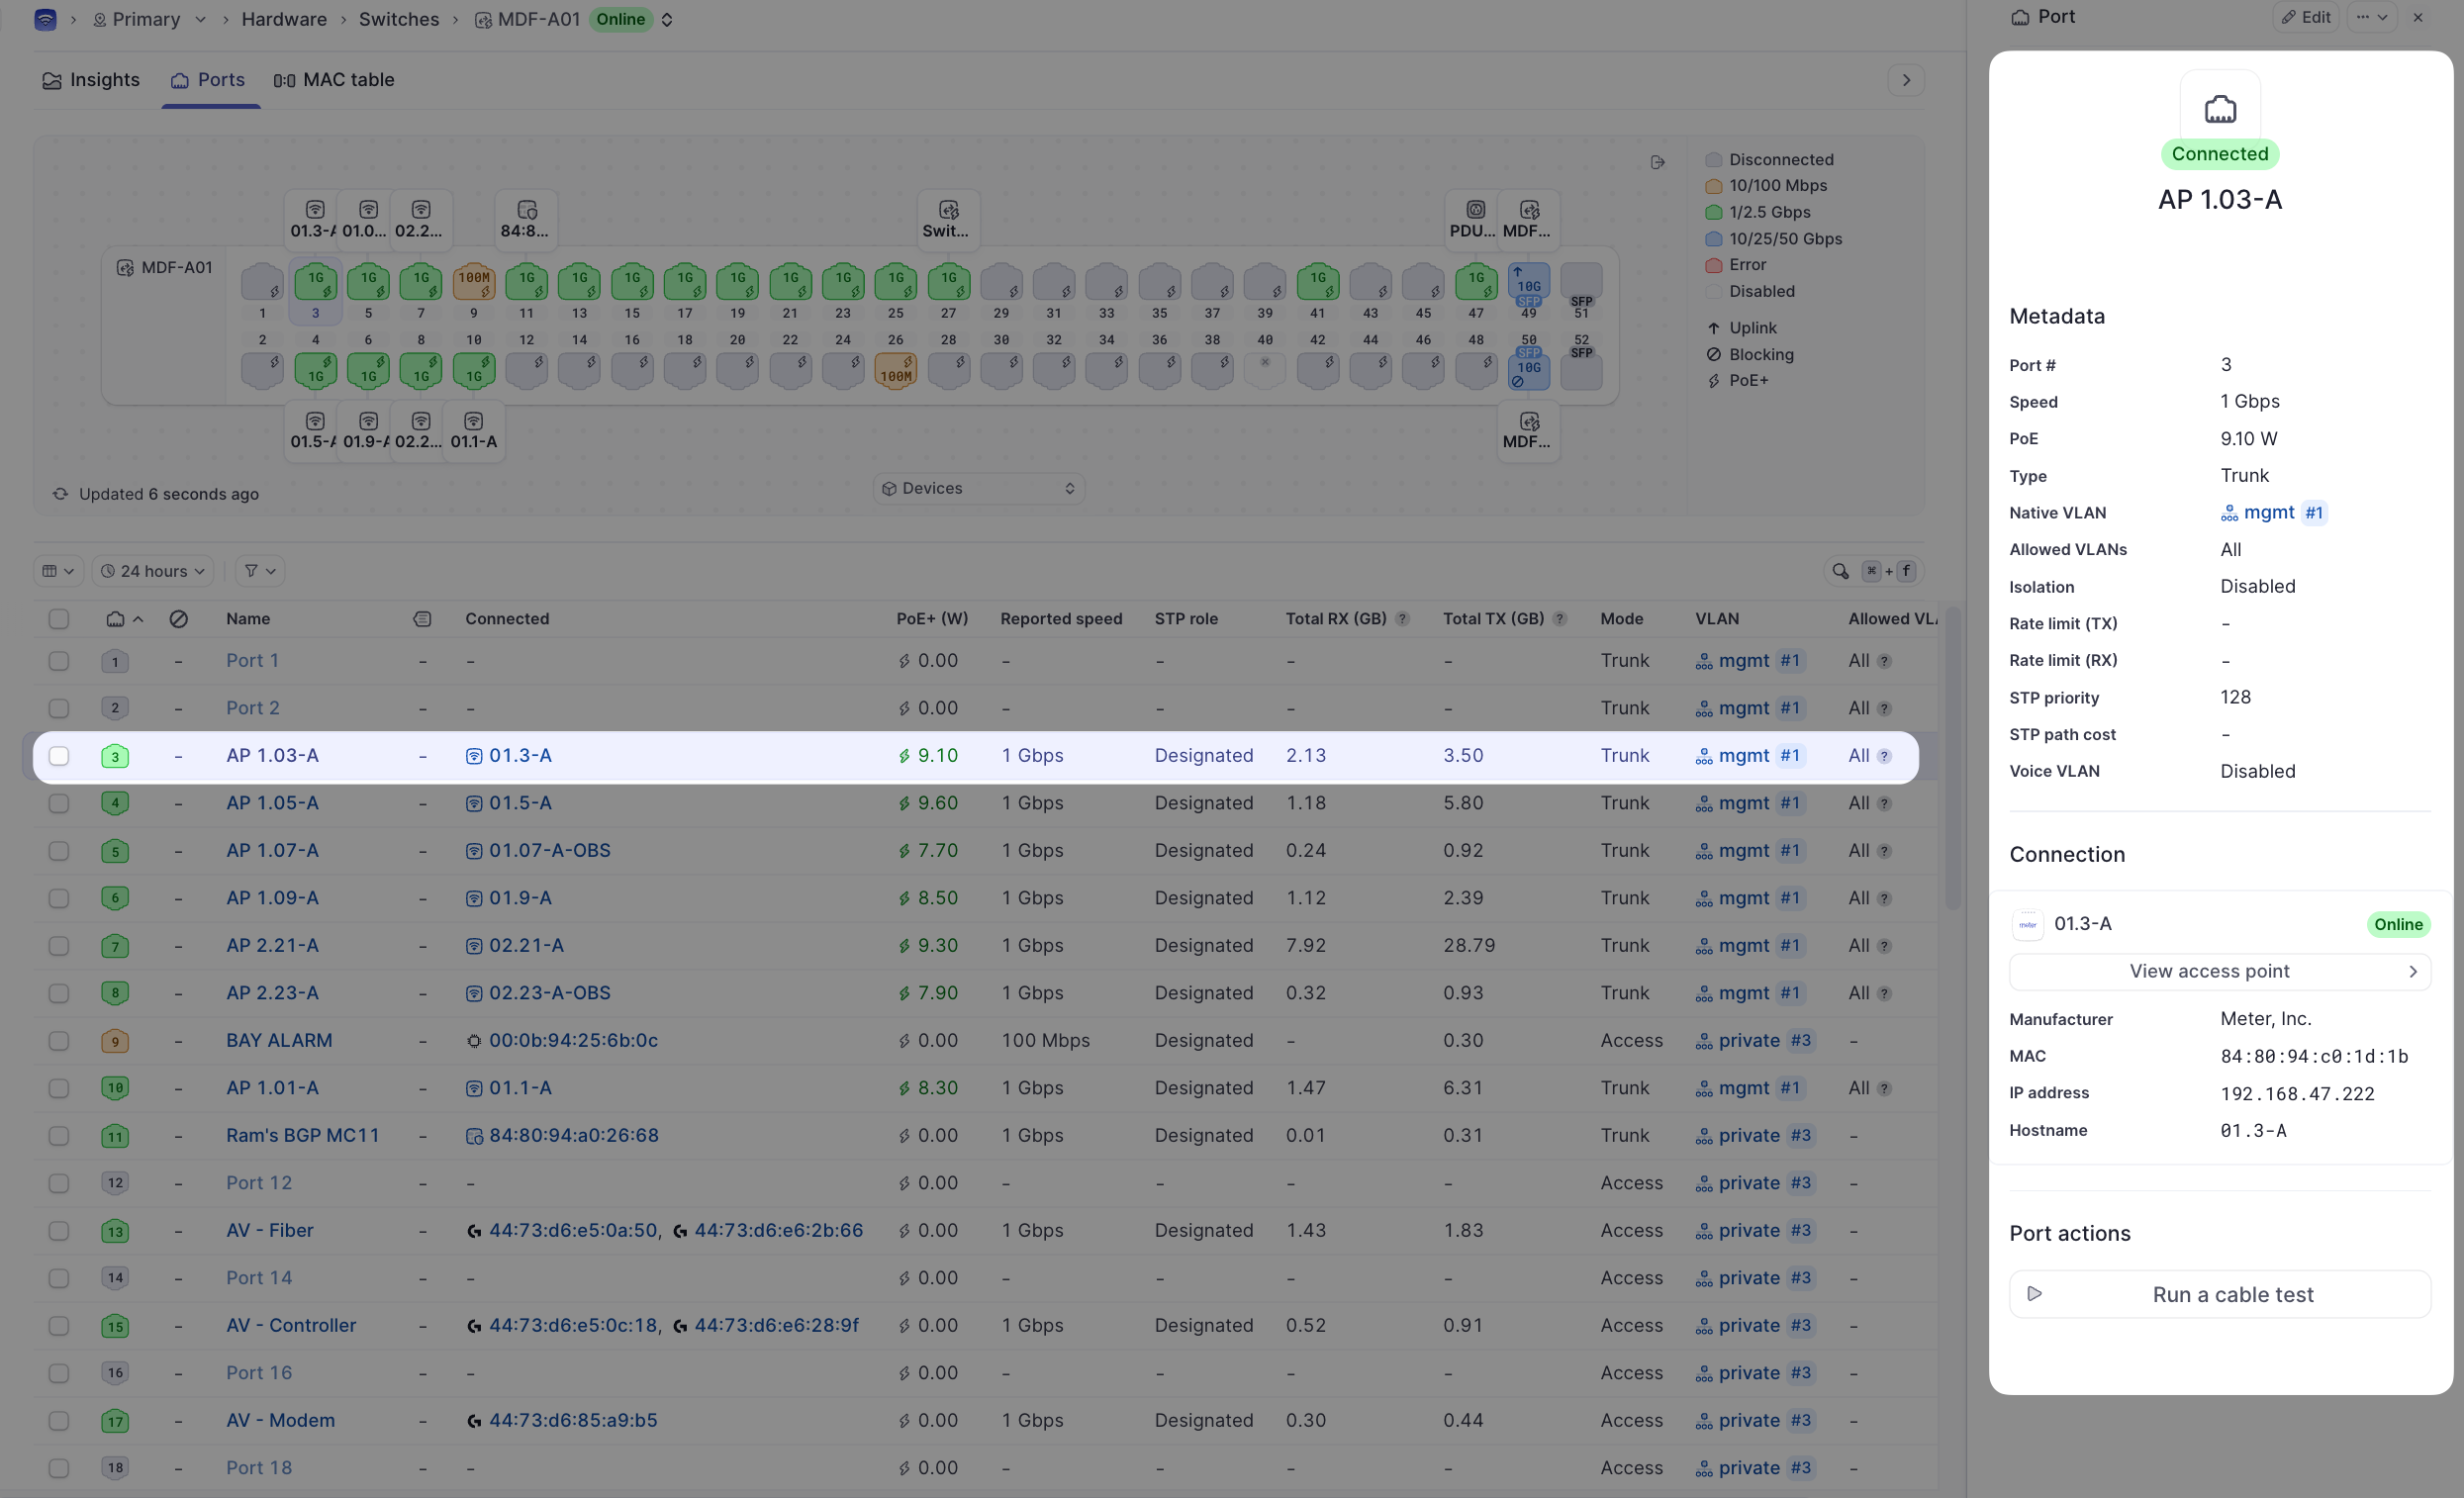
From here, you can view the directly connected client device info. In this case, a Meter access point is directly connected. Clicking the View access point button will take you to the access point details. You can also run a cable test by clicking Run a cable test.
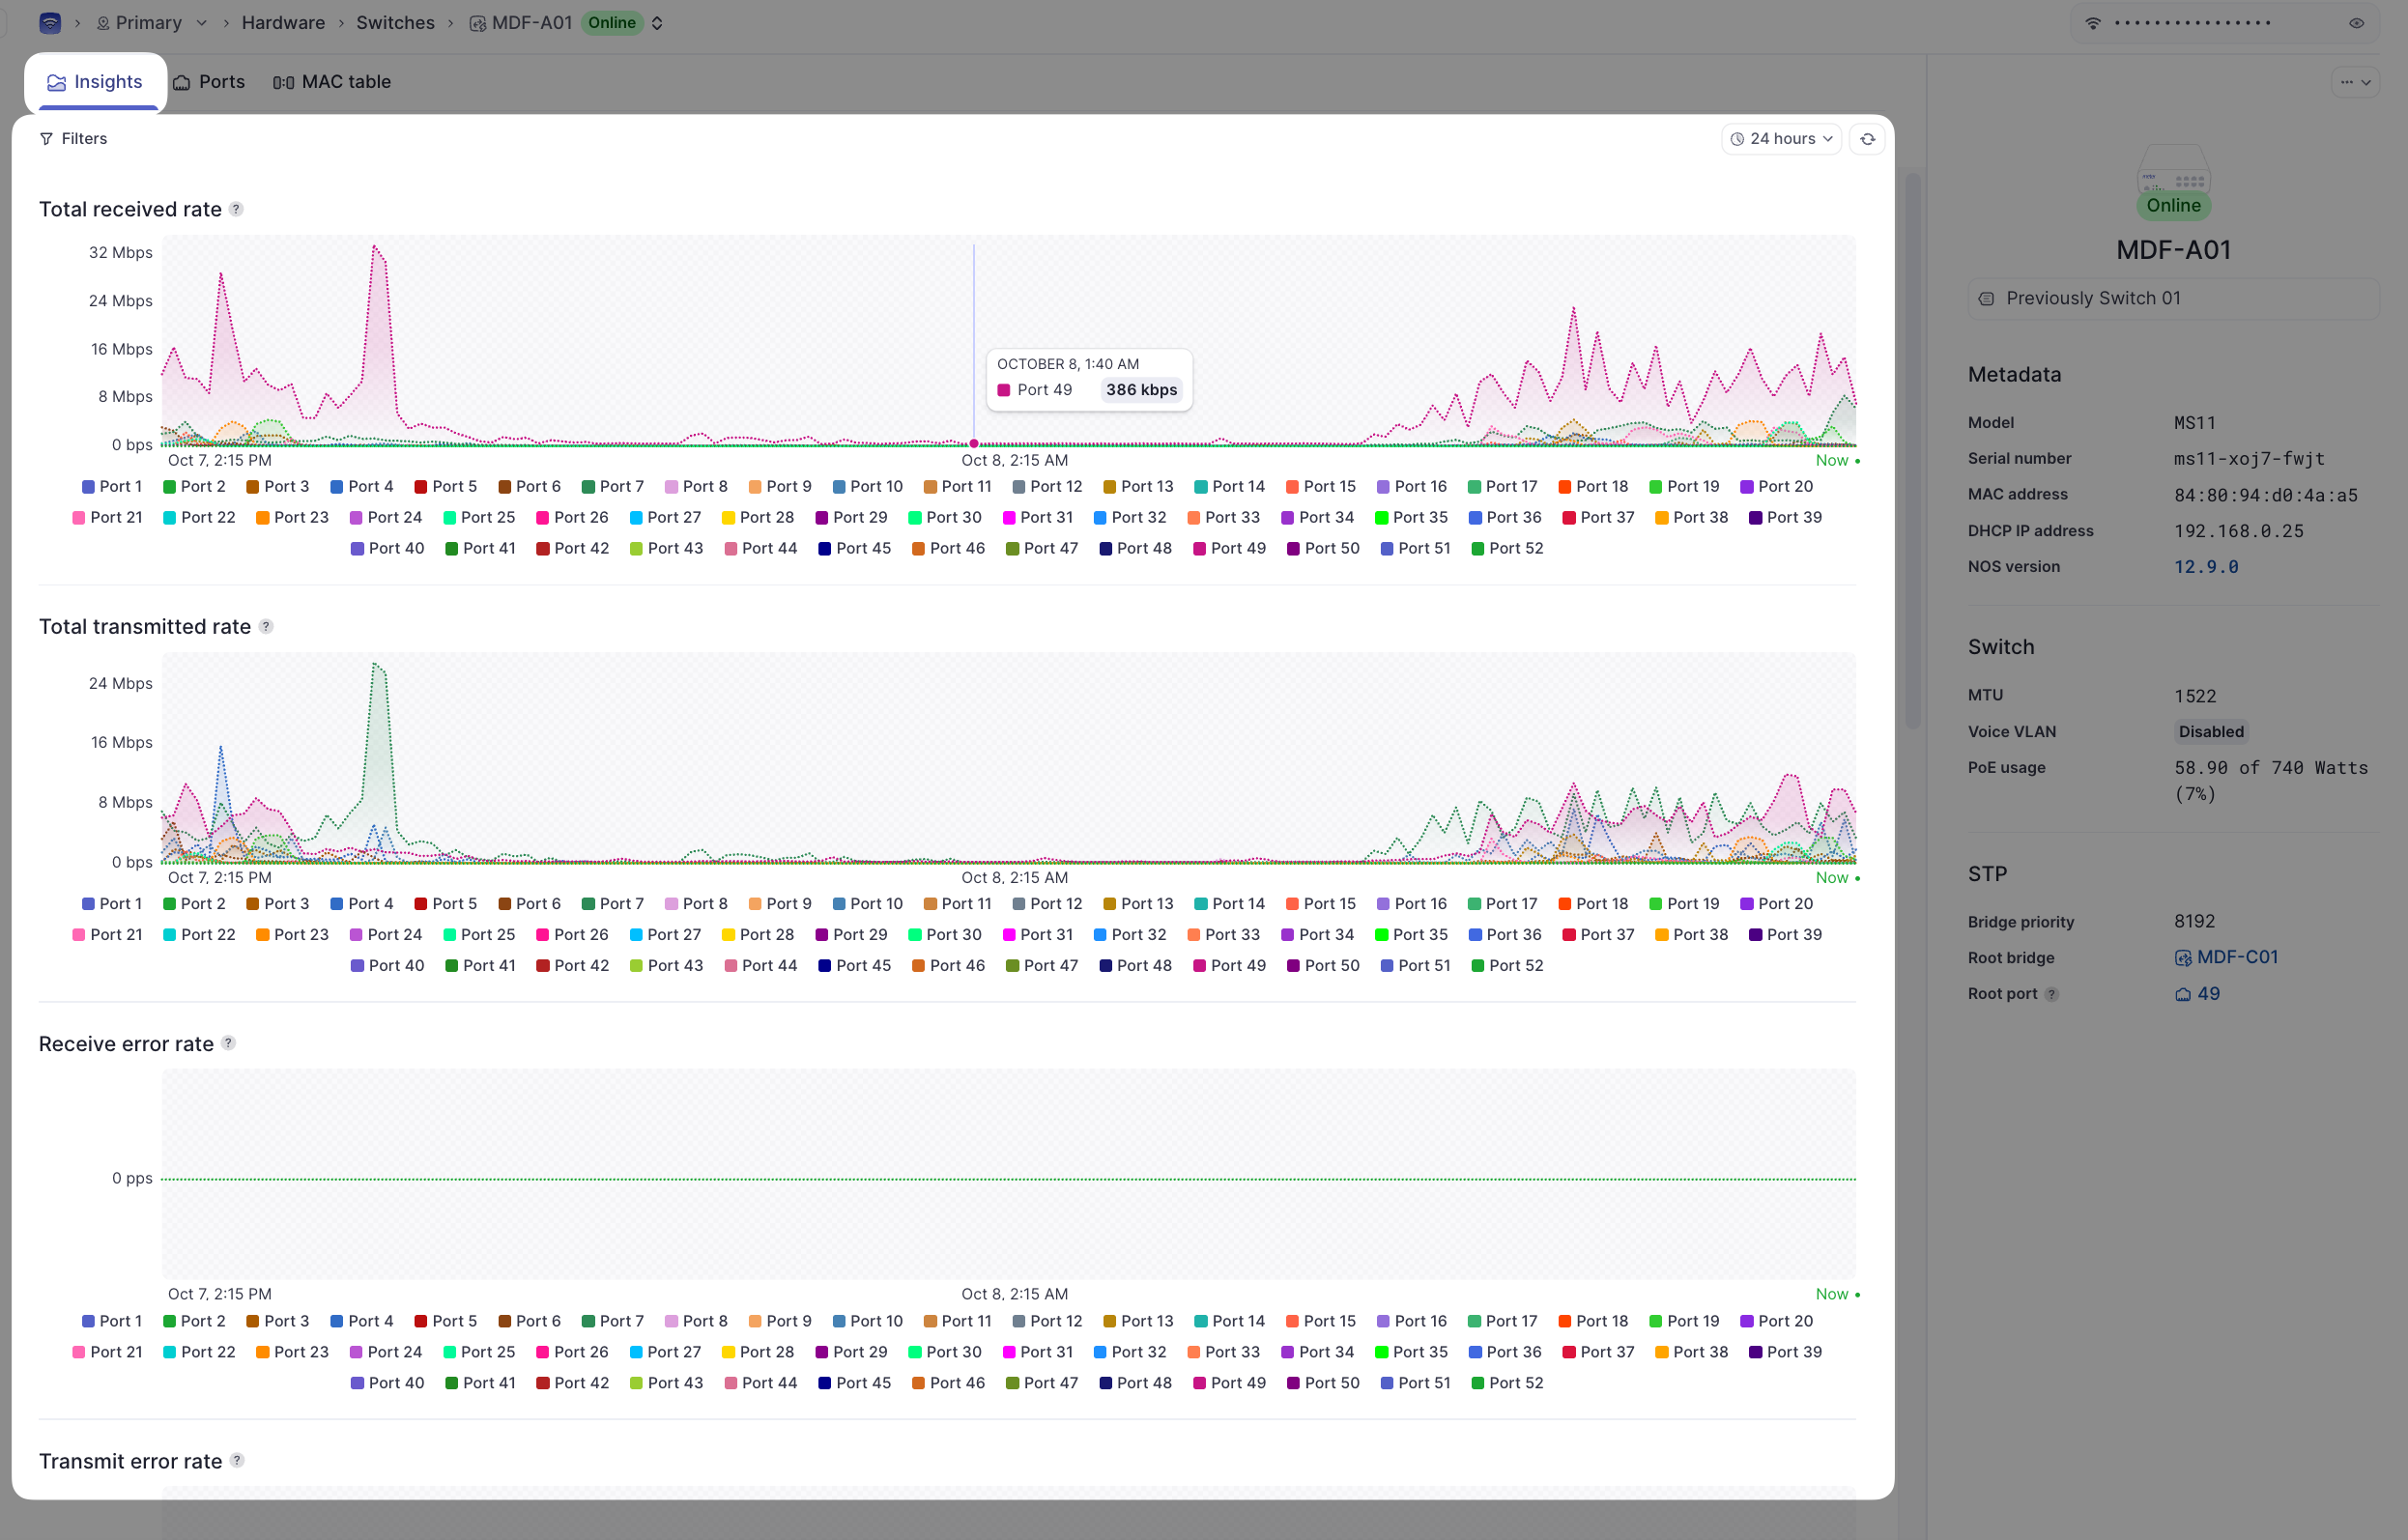
Insights
The Insights page is useful to get a quick picture of health on connected devices.
-
Filters - Look at data for a specific time window and/or specific port
-
Switch RX / TX Throughput - Shows total TX and RX throughput for any given port
-
Error Rates - Shows packet errors for a given port. Ideally, this should be 0. If errors accumulate, running a cable test from the Ports page may be a good idea
-
Discard Rates - Shows how many packets are discarded for a given port
-
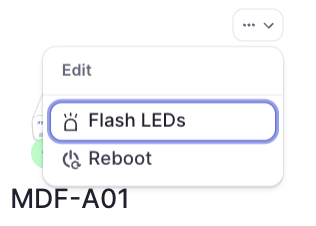
Flash LEDs - Helpful if you are trying to physically locate a switch
Limitations of the network viewer role
This article describes only what can be done by a network viewer. If you need to do any of the following:
- Disable/enable a port
- Disable/enable PoE
- Change/add a VLAN
- Edit port mode/native VLAN
- Change STP settings
- Change port names
You must contact your Network Operator or Meter Support.
Need help?
If you run into any issues or have questions, please reach out to our Support Engineering team by opening a ticket via the Dashboard: https://dashboard.meter.com/support
Last updated by Meter Support Engineering on 01/23/2026