Who can access this feature?
- Partner
- Company/Network Admins with write and read access
- Meter Support
Overview
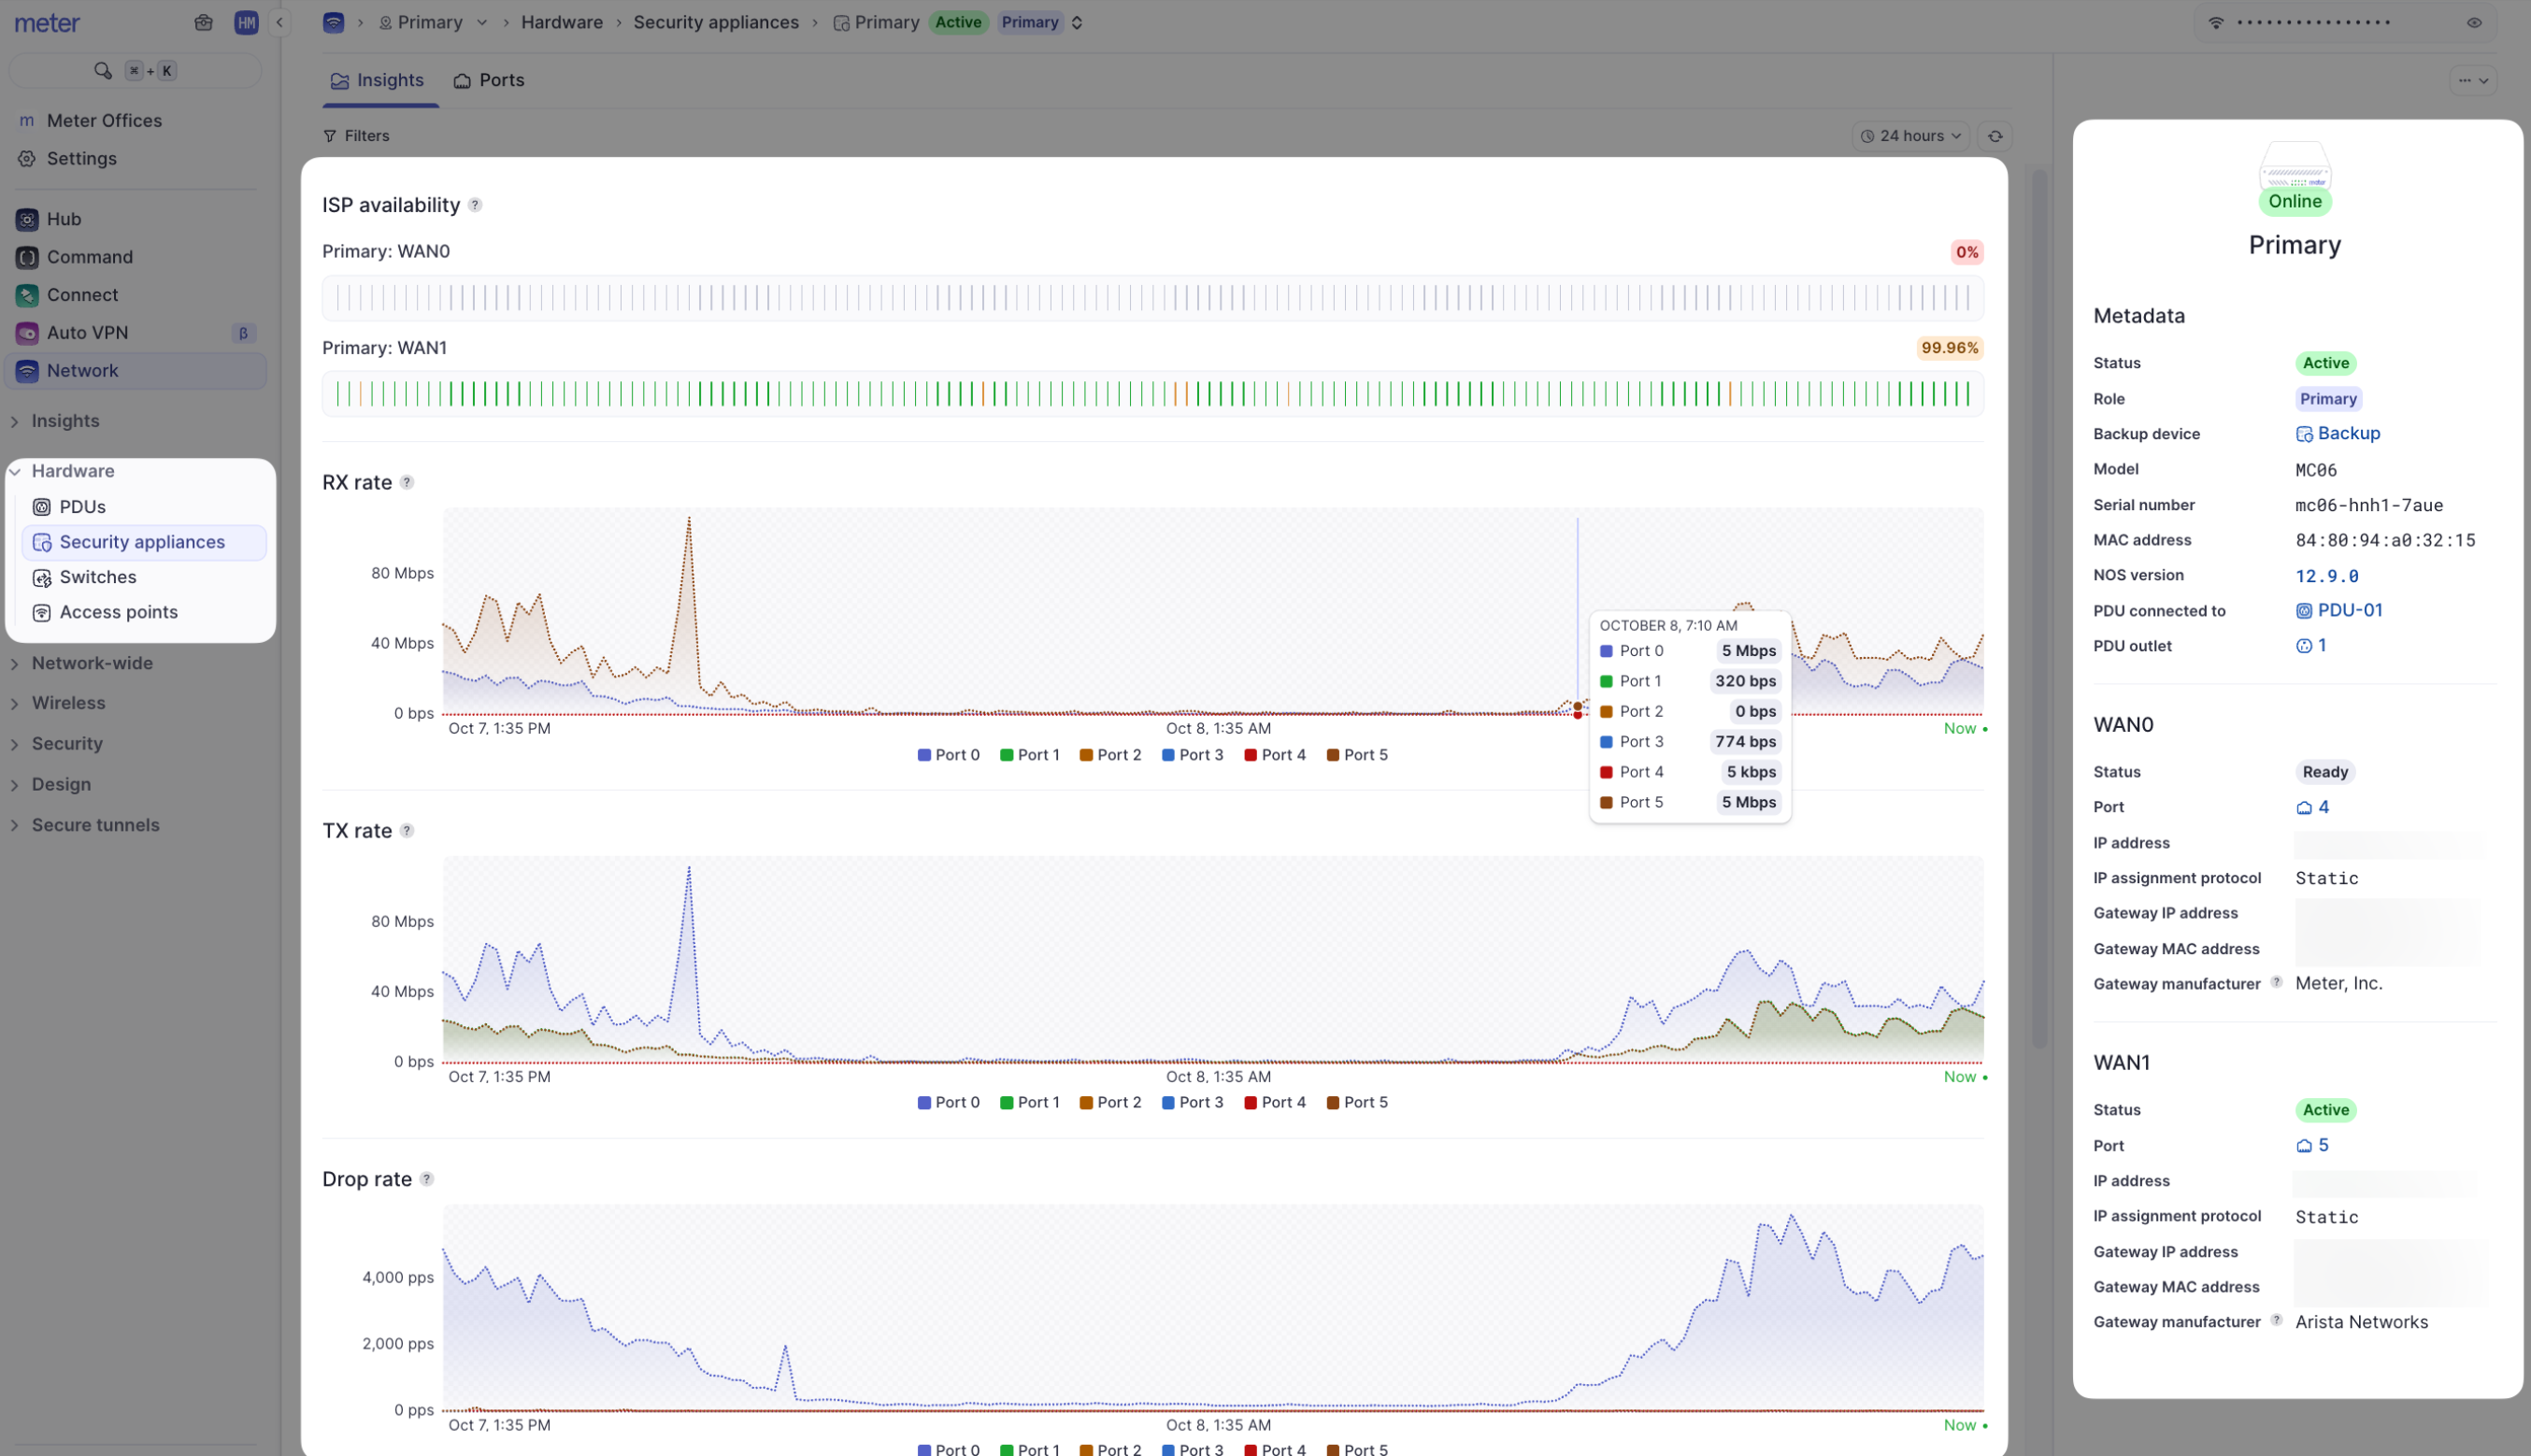
For monitoring and health checks of your Meter Firewalls, the Insights tab provides detailed information. To access this page, navigate to Hardware > Firewalls > Insights.
On the top of the page, note that you may have more than one Firewall listed. You may have a cold spare or an additional appliance for high availability. Ensure that the Firewall you would like to look at is selected.
Page components
- Metadata - The model and MAC address of the Meter Firewall are listed here. In addition, there is information about the connected ISPs, including IP address, MAC address of upstream ISP equipment, and an indication of which ISP is currently active if using first-active failover
- ISP availability - These charts display the percentage of uptime for the ISP(s) given your selected time filter (top-right of the screen)
- Usage and error/drop charts - The Y-axis of each chart is PPS (packets per second). Each chart can be filtered by clicking on a port number below the chart to view stats on a specific port. To see what each port number represents, view the Ports page for the Firewall
Actions and edit menus
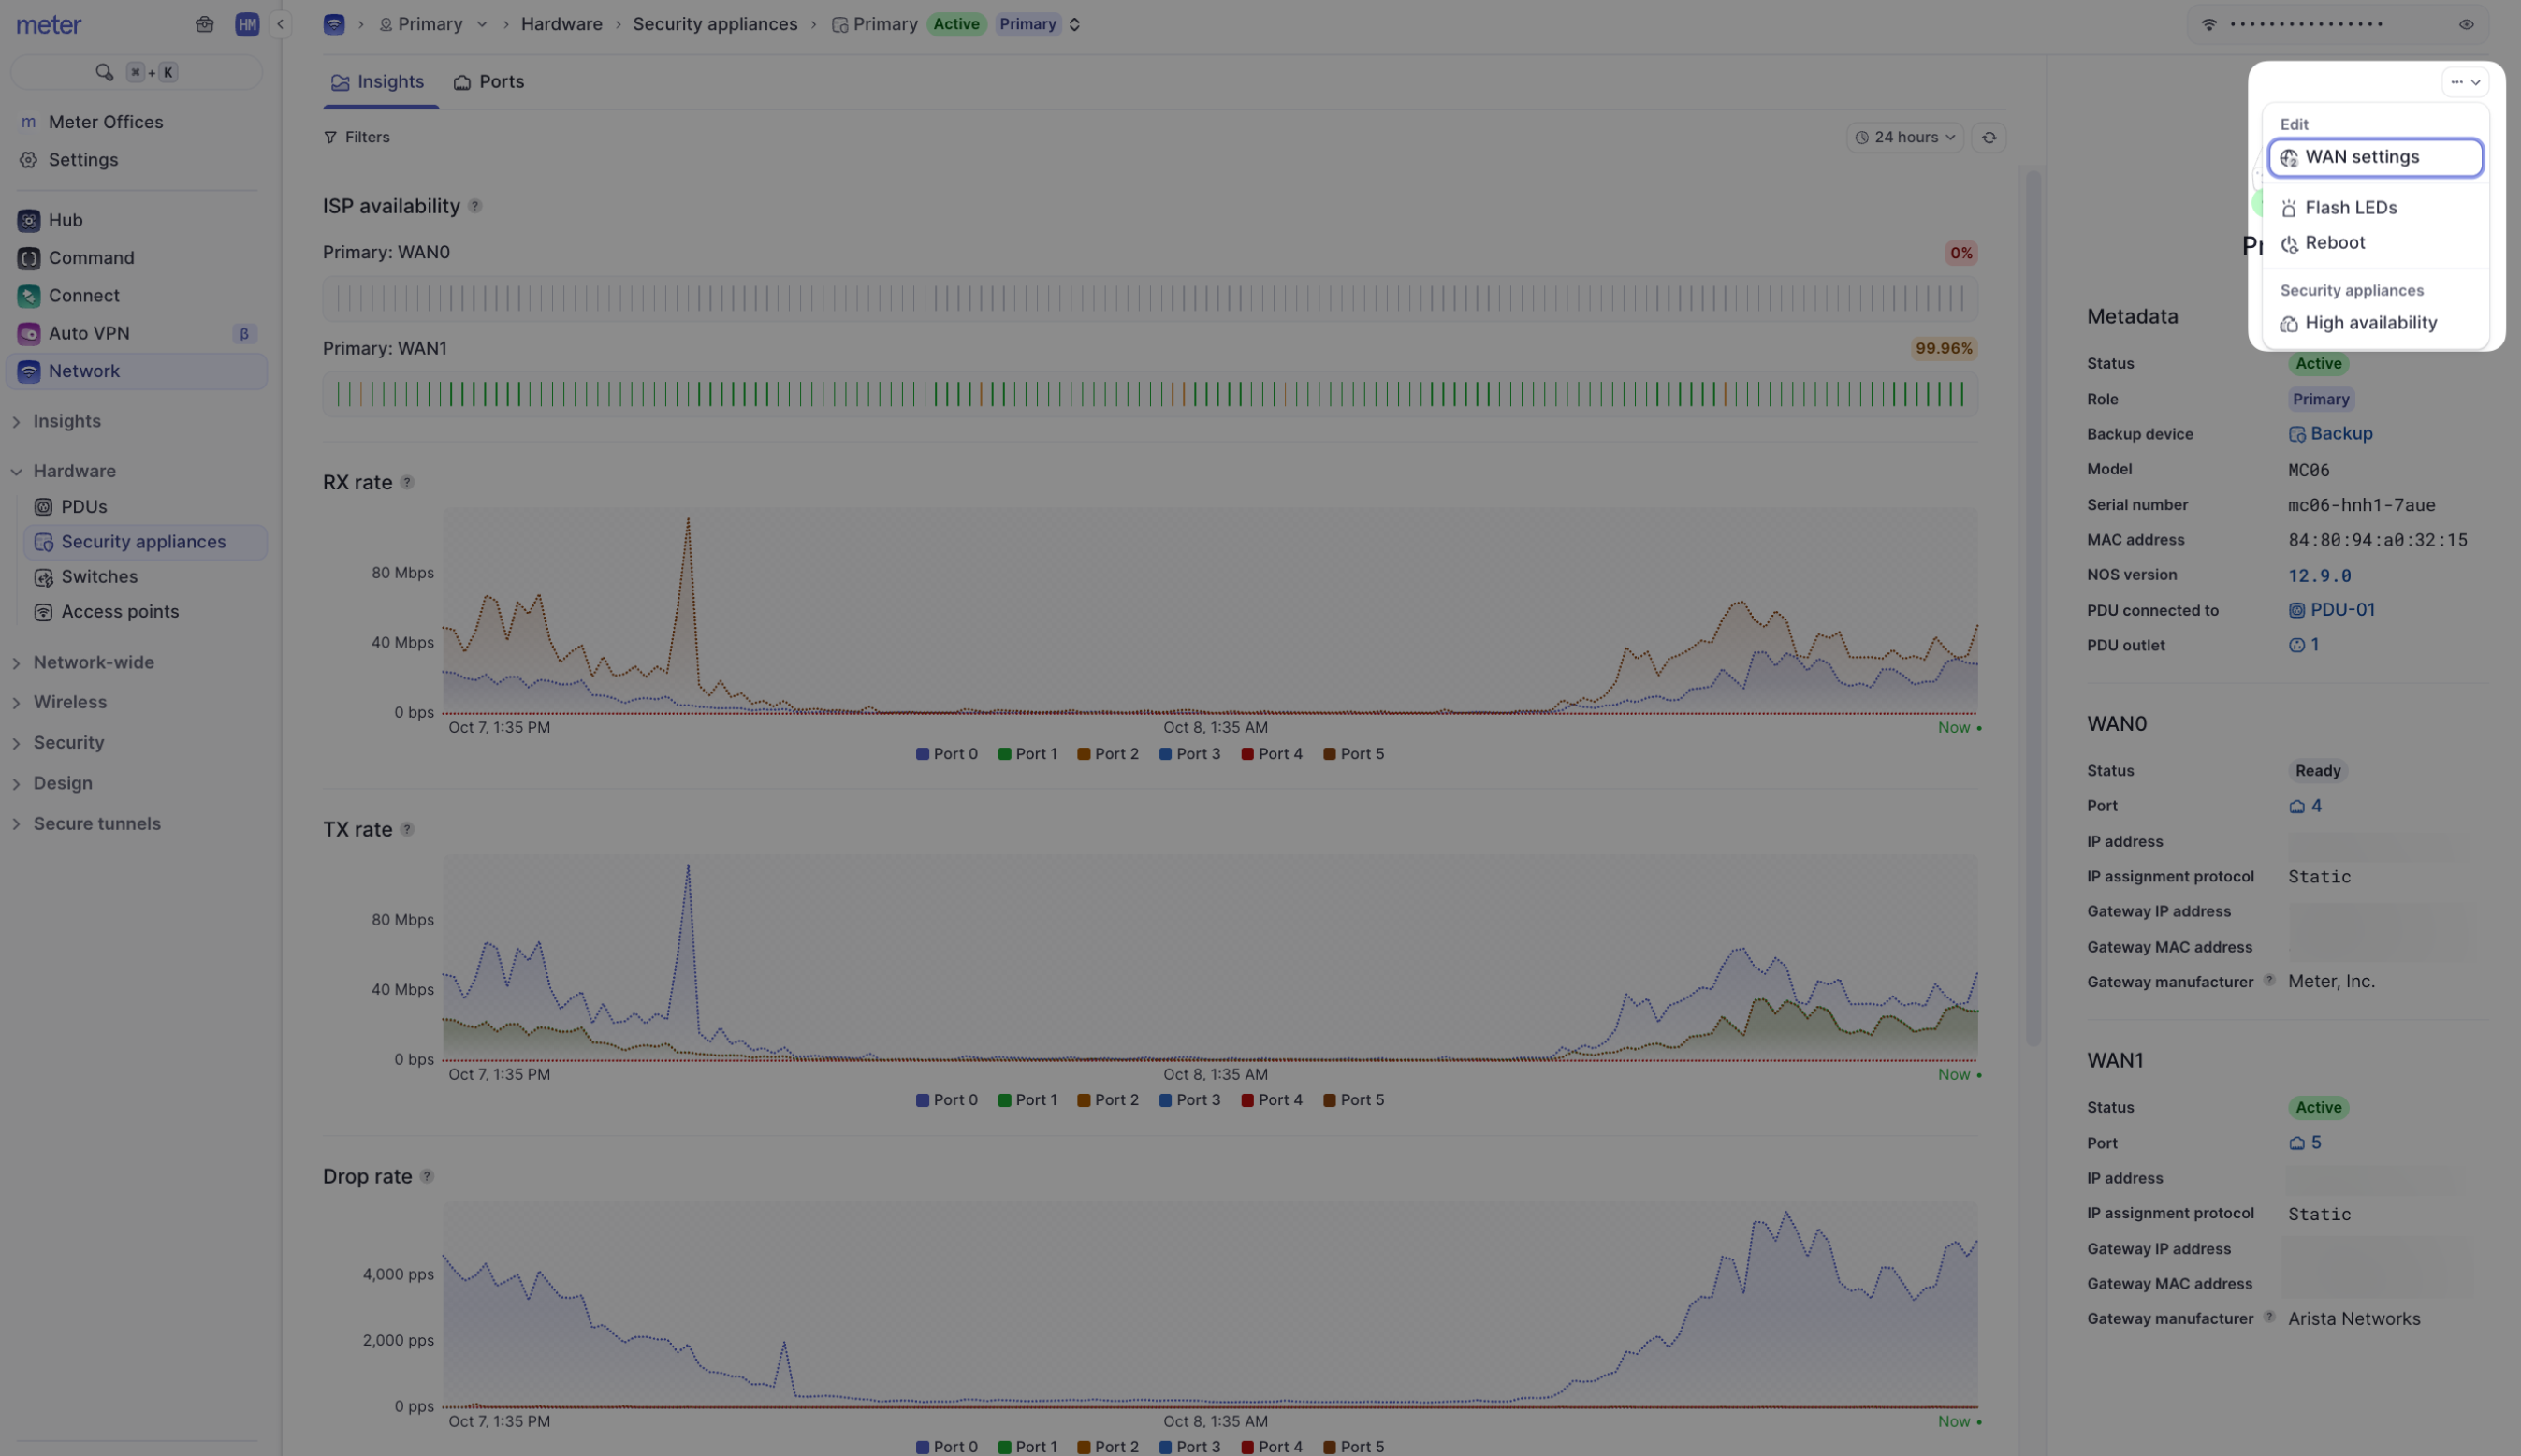
The actions menu is located on the top-right corner of the Insights page (⋯).
With the edit menu, you can change the display label of the Firewall in the Dashboard and add an optional description.
In the Actions menu, you can:
- Flash LEDs - Flash the LEDs on the Firewall to easily locate it in the network closet
- Reboot - Remotely reboot the Firewall if needed (the Firewall must report as "Online" for this function)
Are drops or errors always a bad thing?
No - in some cases, packets should be dropped by the Firewall. A small amount of errors is also typical and may not indicate any problem.
However, large amounts or spikes in rates/errors should be investigated. If you see this type of pattern, please reach out to Meter Support.
Need help?
If you run into any issues or have questions, please reach out to our Support Engineering team by opening a ticket via the Dashboard: https://dashboard.meter.com/support
Last updated by Meter Support Engineering on 01/23/2026