Who can access this feature?
- Partner
- Company/Network Admins with write and read access
- Meter Support
Overview
The Insights page of a Meter access point offers insights into the general health and status of the access point and its connected clients.
To view the Insights page of an access point, log into the Meter Dashboard and navigate to Hardware > Access Points and click the name of an access point.
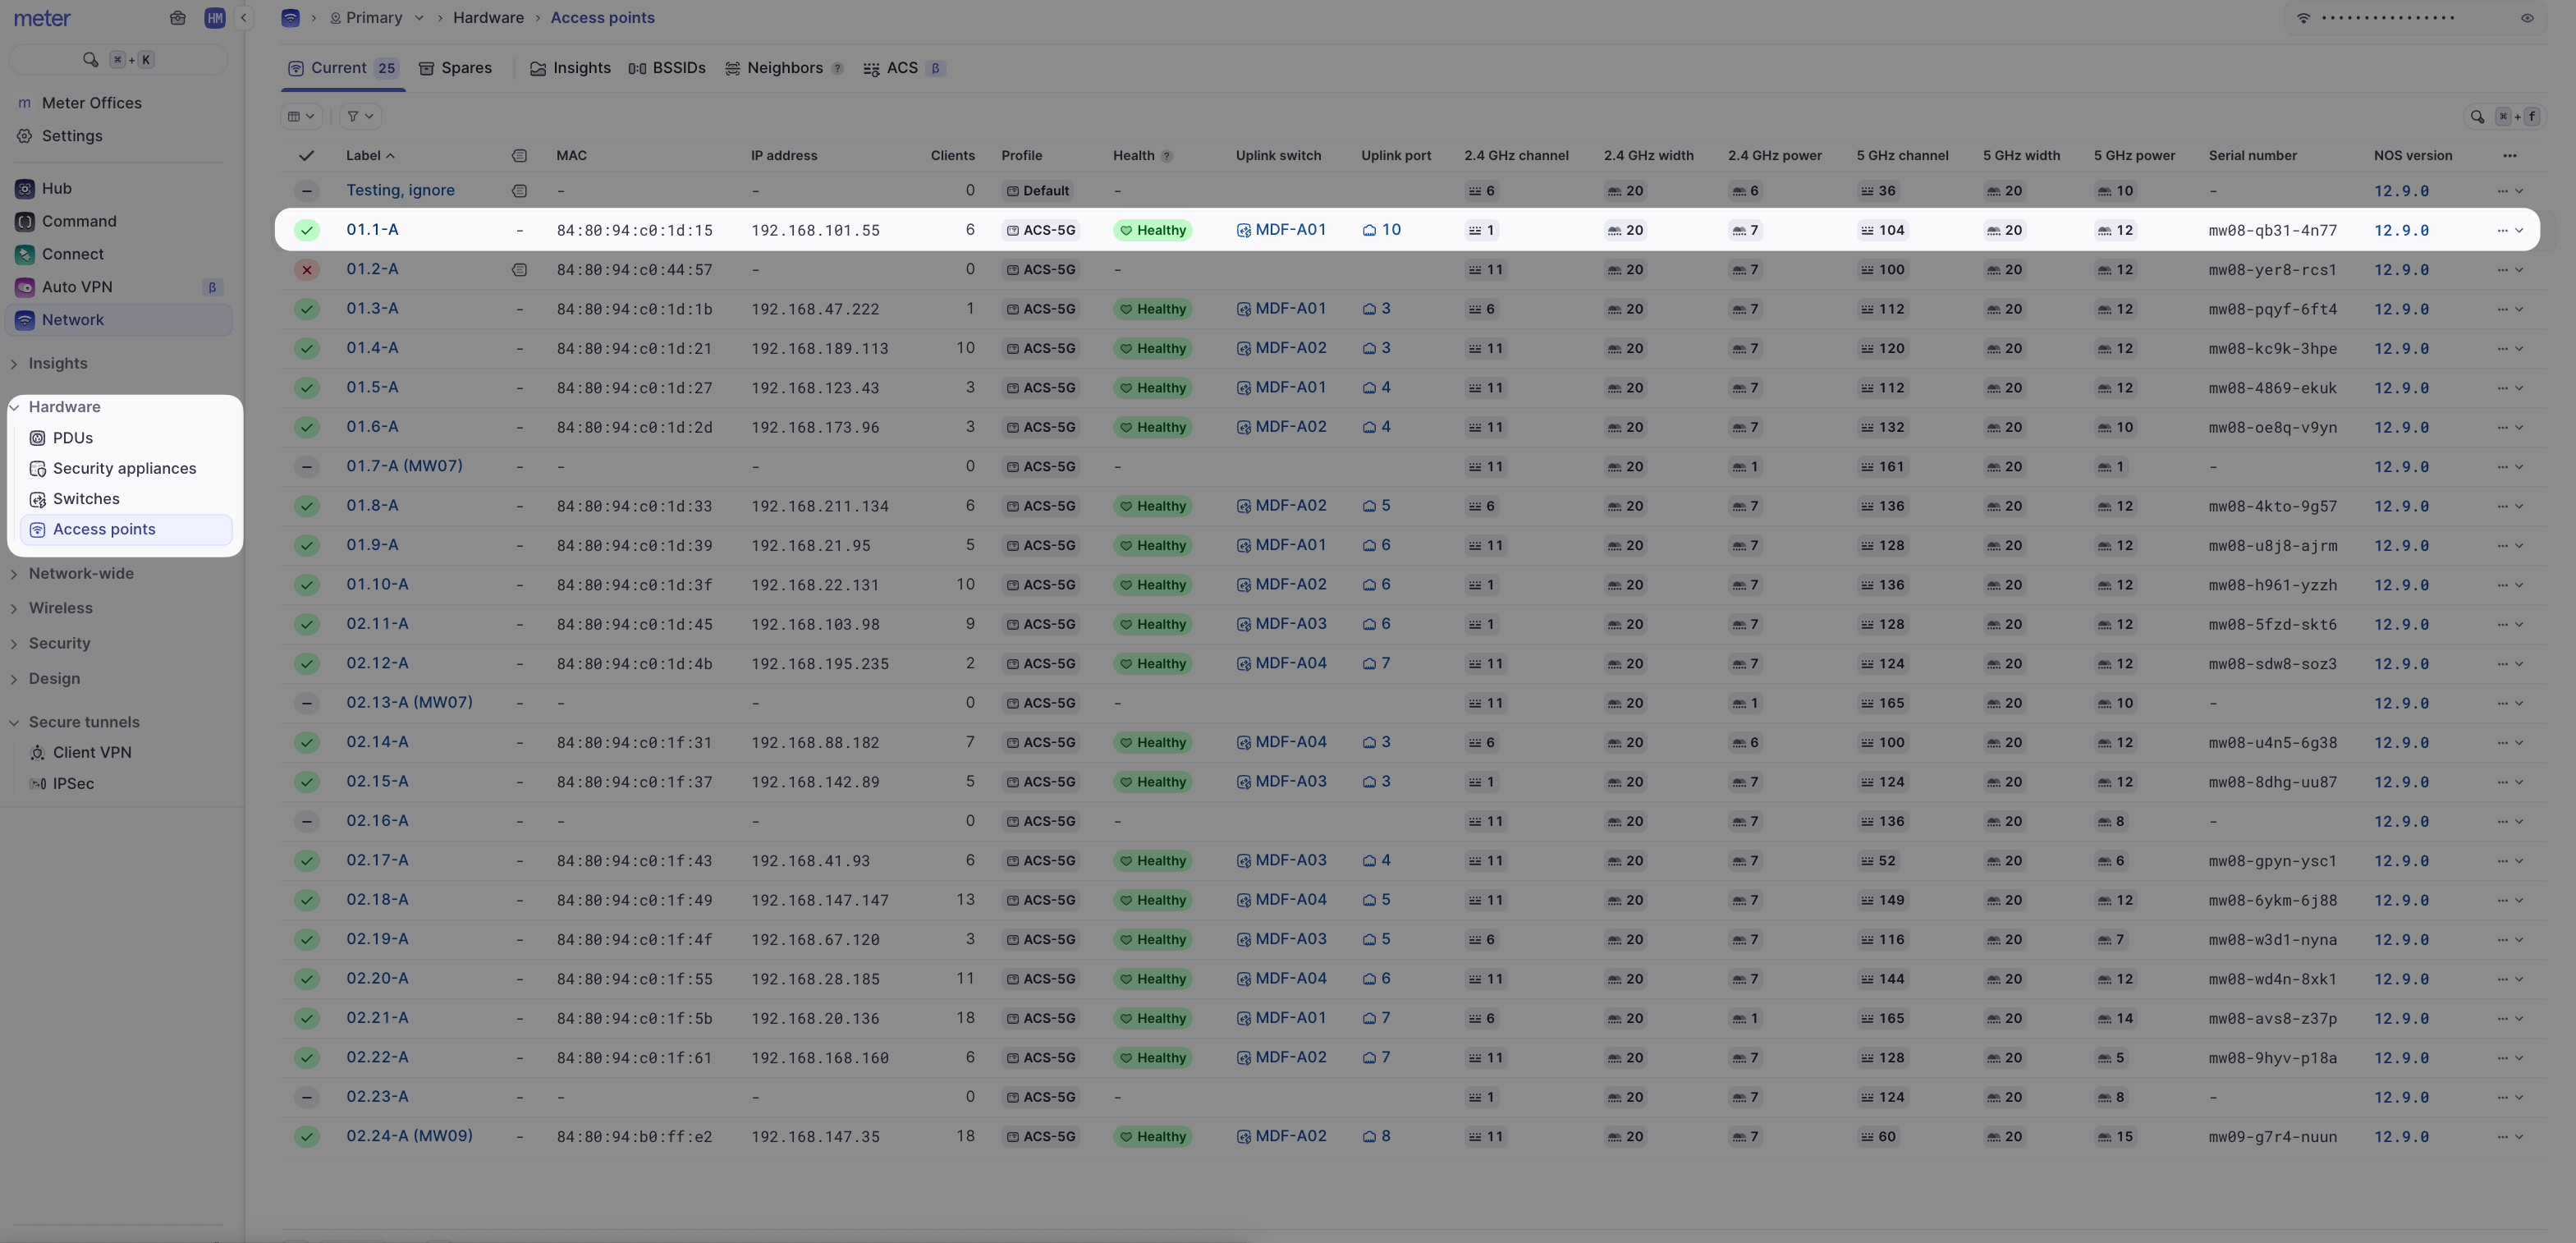
The Insights page displays:
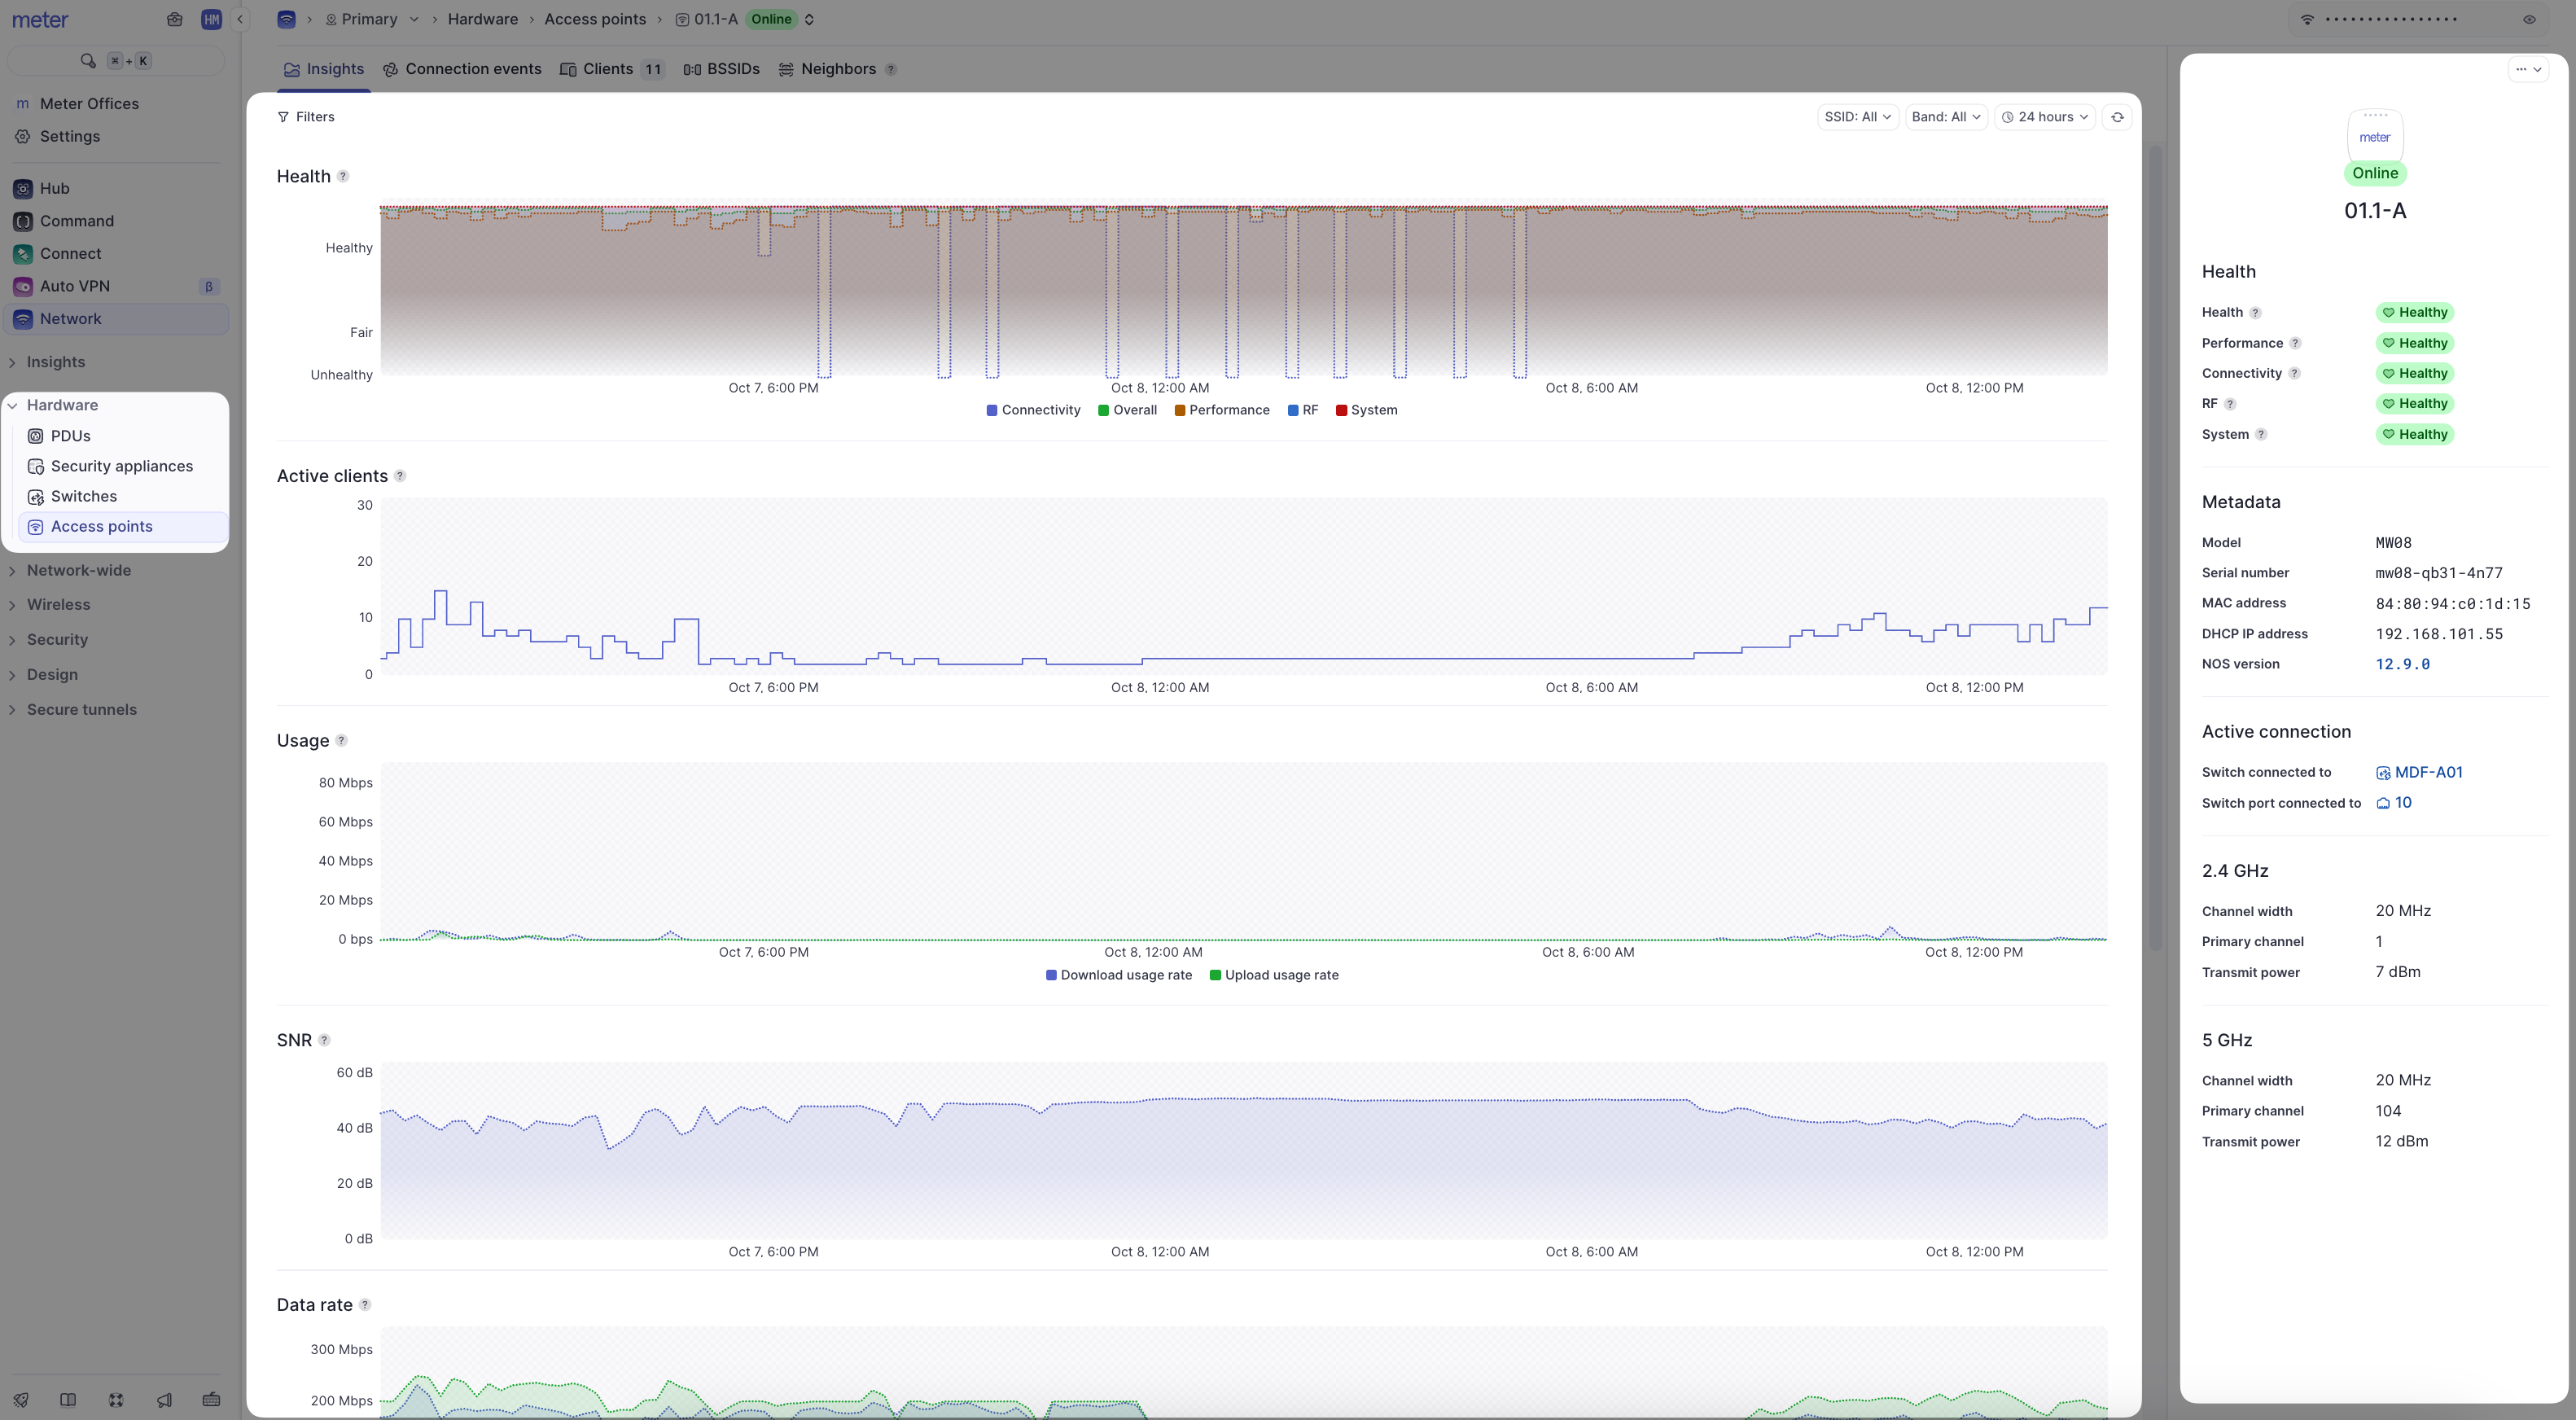
- Filters - Filter by time period, SSID, or band (2.4 GHz or 5 GHz)
- Metadata - Information about the access point's hardware, connection, and physical radios
- Heartbeat/health stats - The heartbeat represents the access point's overall health score for the last 30 minutes. This is calculated using the health stats listed below the heartbeat status. The heartbeat and stats are color-coded (green, yellow, or red) to represent health
- Client count - How many clients were connected to the access point at the given time
- Usage - The total amount of data sent and received by clients connected to the access point
- SNR - The average SNR of all clients connected to the access point
- Data rate - The average data rates at which clients are connecting to the access point
- Data traffic - The amount of unicast and multicast packets being sent and received by the access point
- Channel utilization - The percentage of time that the access point's channel is being utilized at the given time
Data representation
It is not feasible to send all real-time data to the Dashboard as this would be incredibly resource-intensive. Instead, averages are used depending on your selected time filter:
| Time filter | Data interval |
|---|---|
| Up to 24 hours | 5-minute intervals |
| 24 hours to 30 days | 30-minute intervals |
| 30 days+ | 1-hour intervals |
You may notice data appear to change when selecting different time windows as averages will change for different intervals.
What to look for
Large client counts
In general, once an access point starts nearing 100 clients there could be some noticeable performance issues. However, this also depends on what the client devices are doing while on the Wi-Fi. On deployment, Meter plans capacity but we understand things may change. If you regularly have access points near or over 100 clients, please reach out to Meter Support if you are experiencing performance issues.
Low SNR
A low average SNR among all clients connected to an access point could indicate unexpected attenuation due to environmental factors, or clients "sticking" to the access point longer than they should. A low SNR impacts the overall Wi-Fi quality perceived by the client devices.
High channel utilization
High channel utilization will cause the Wi-Fi network to slow down as data needs to wait longer before being transmitted. Meter defines "high utilization" as utilization sustaining at 60% or higher for more than several minutes.
Need help?
If you run into any issues or have questions, please reach out to our Support Engineering team by opening a ticket via the Dashboard: https://dashboard.meter.com/support
Last updated by Meter Support Engineering on 01/23/2026