Who can access this feature?
- Partner
- Company/Network Admins with write and read access
- Meter Support
Overview
The switch Insights page provides more granular information about switch port rates, errors, drops, and types of traffic being seen on the port. To view the switch Insights page, click Hardware > Switches and click the desired switch.
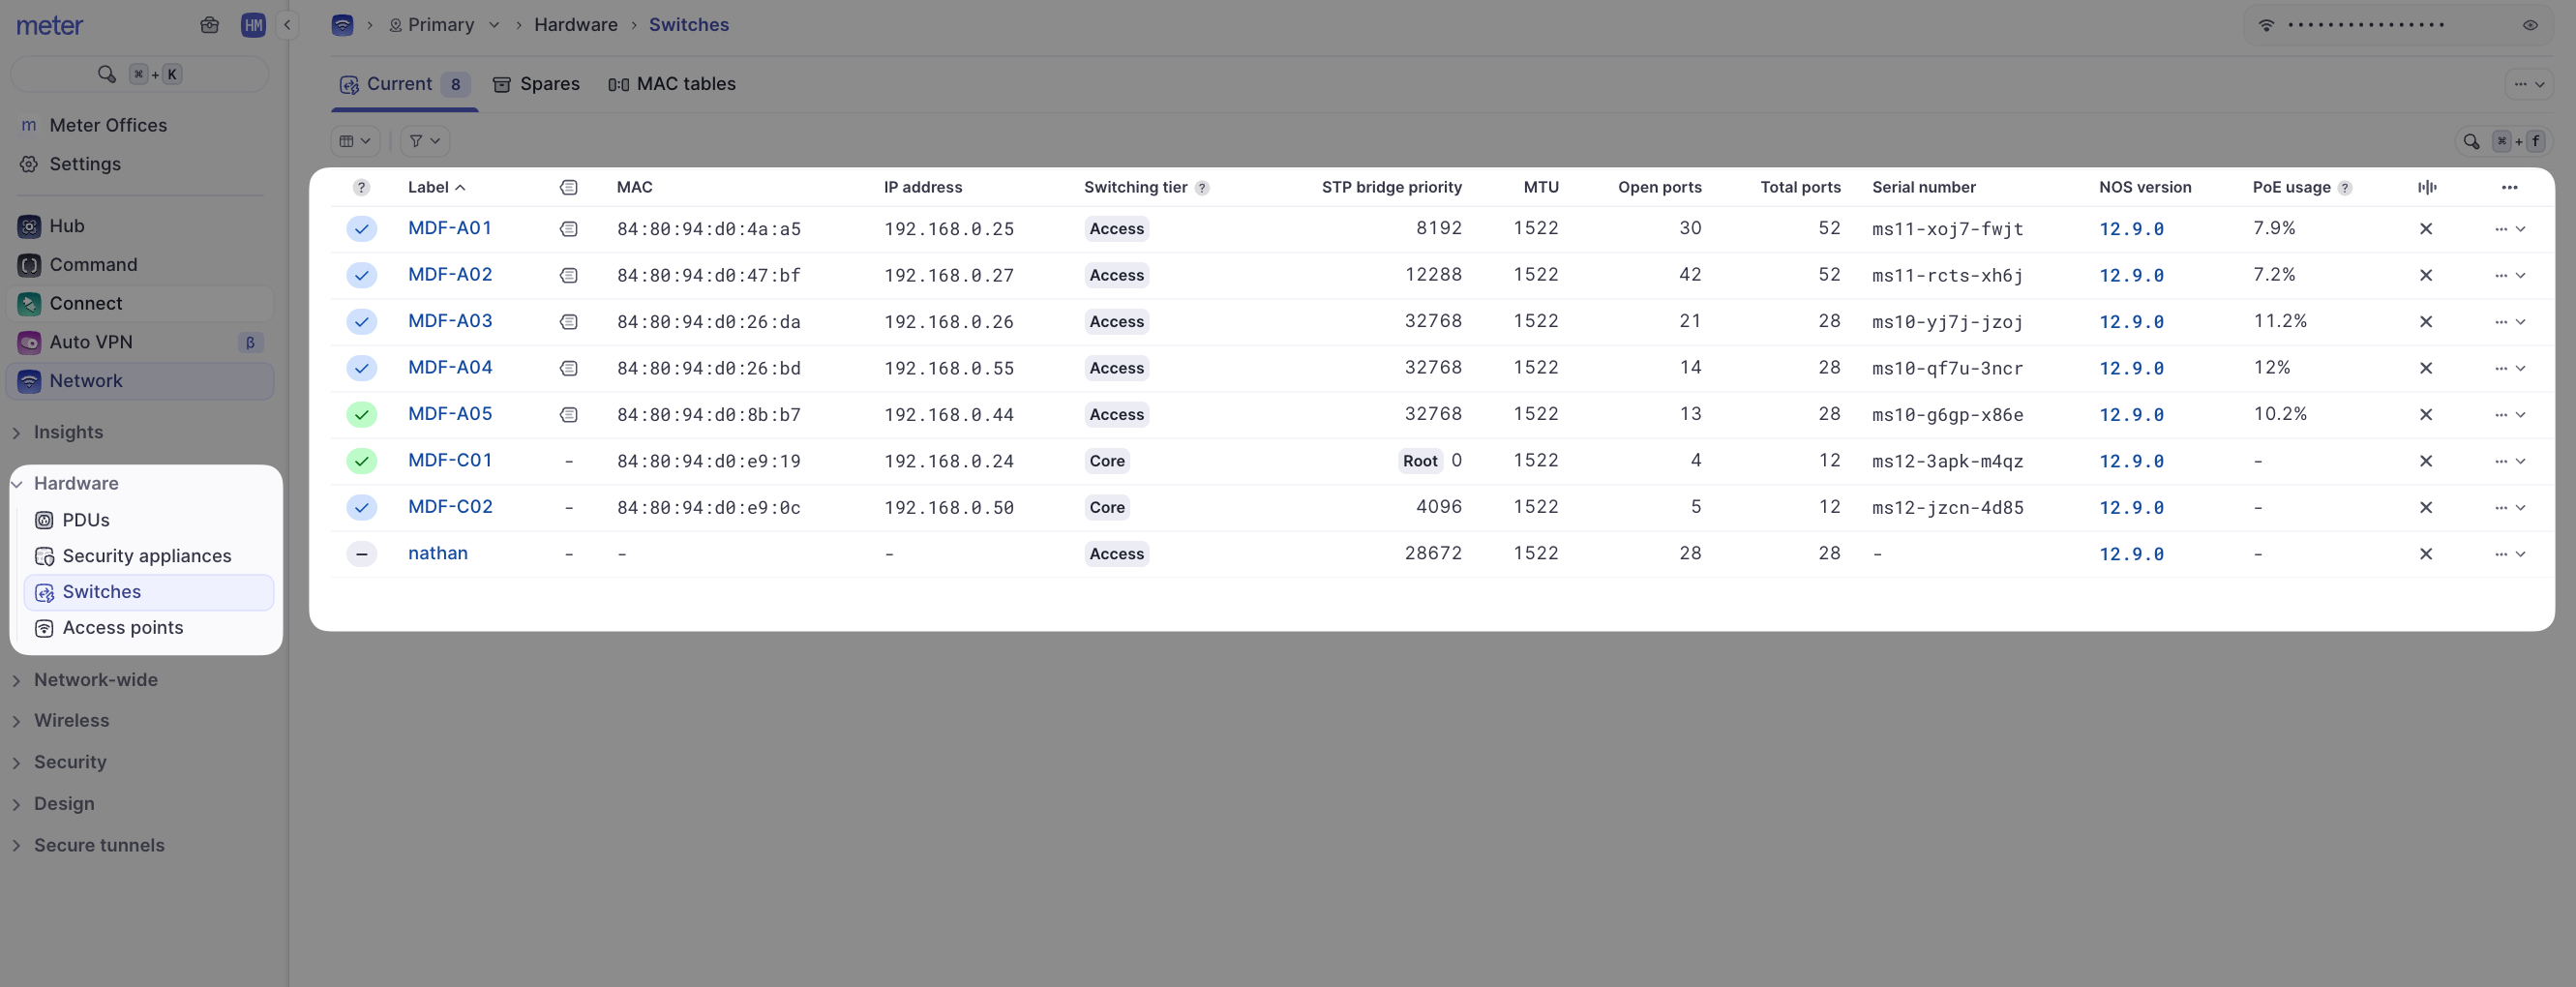
The Insights page will then be displayed.
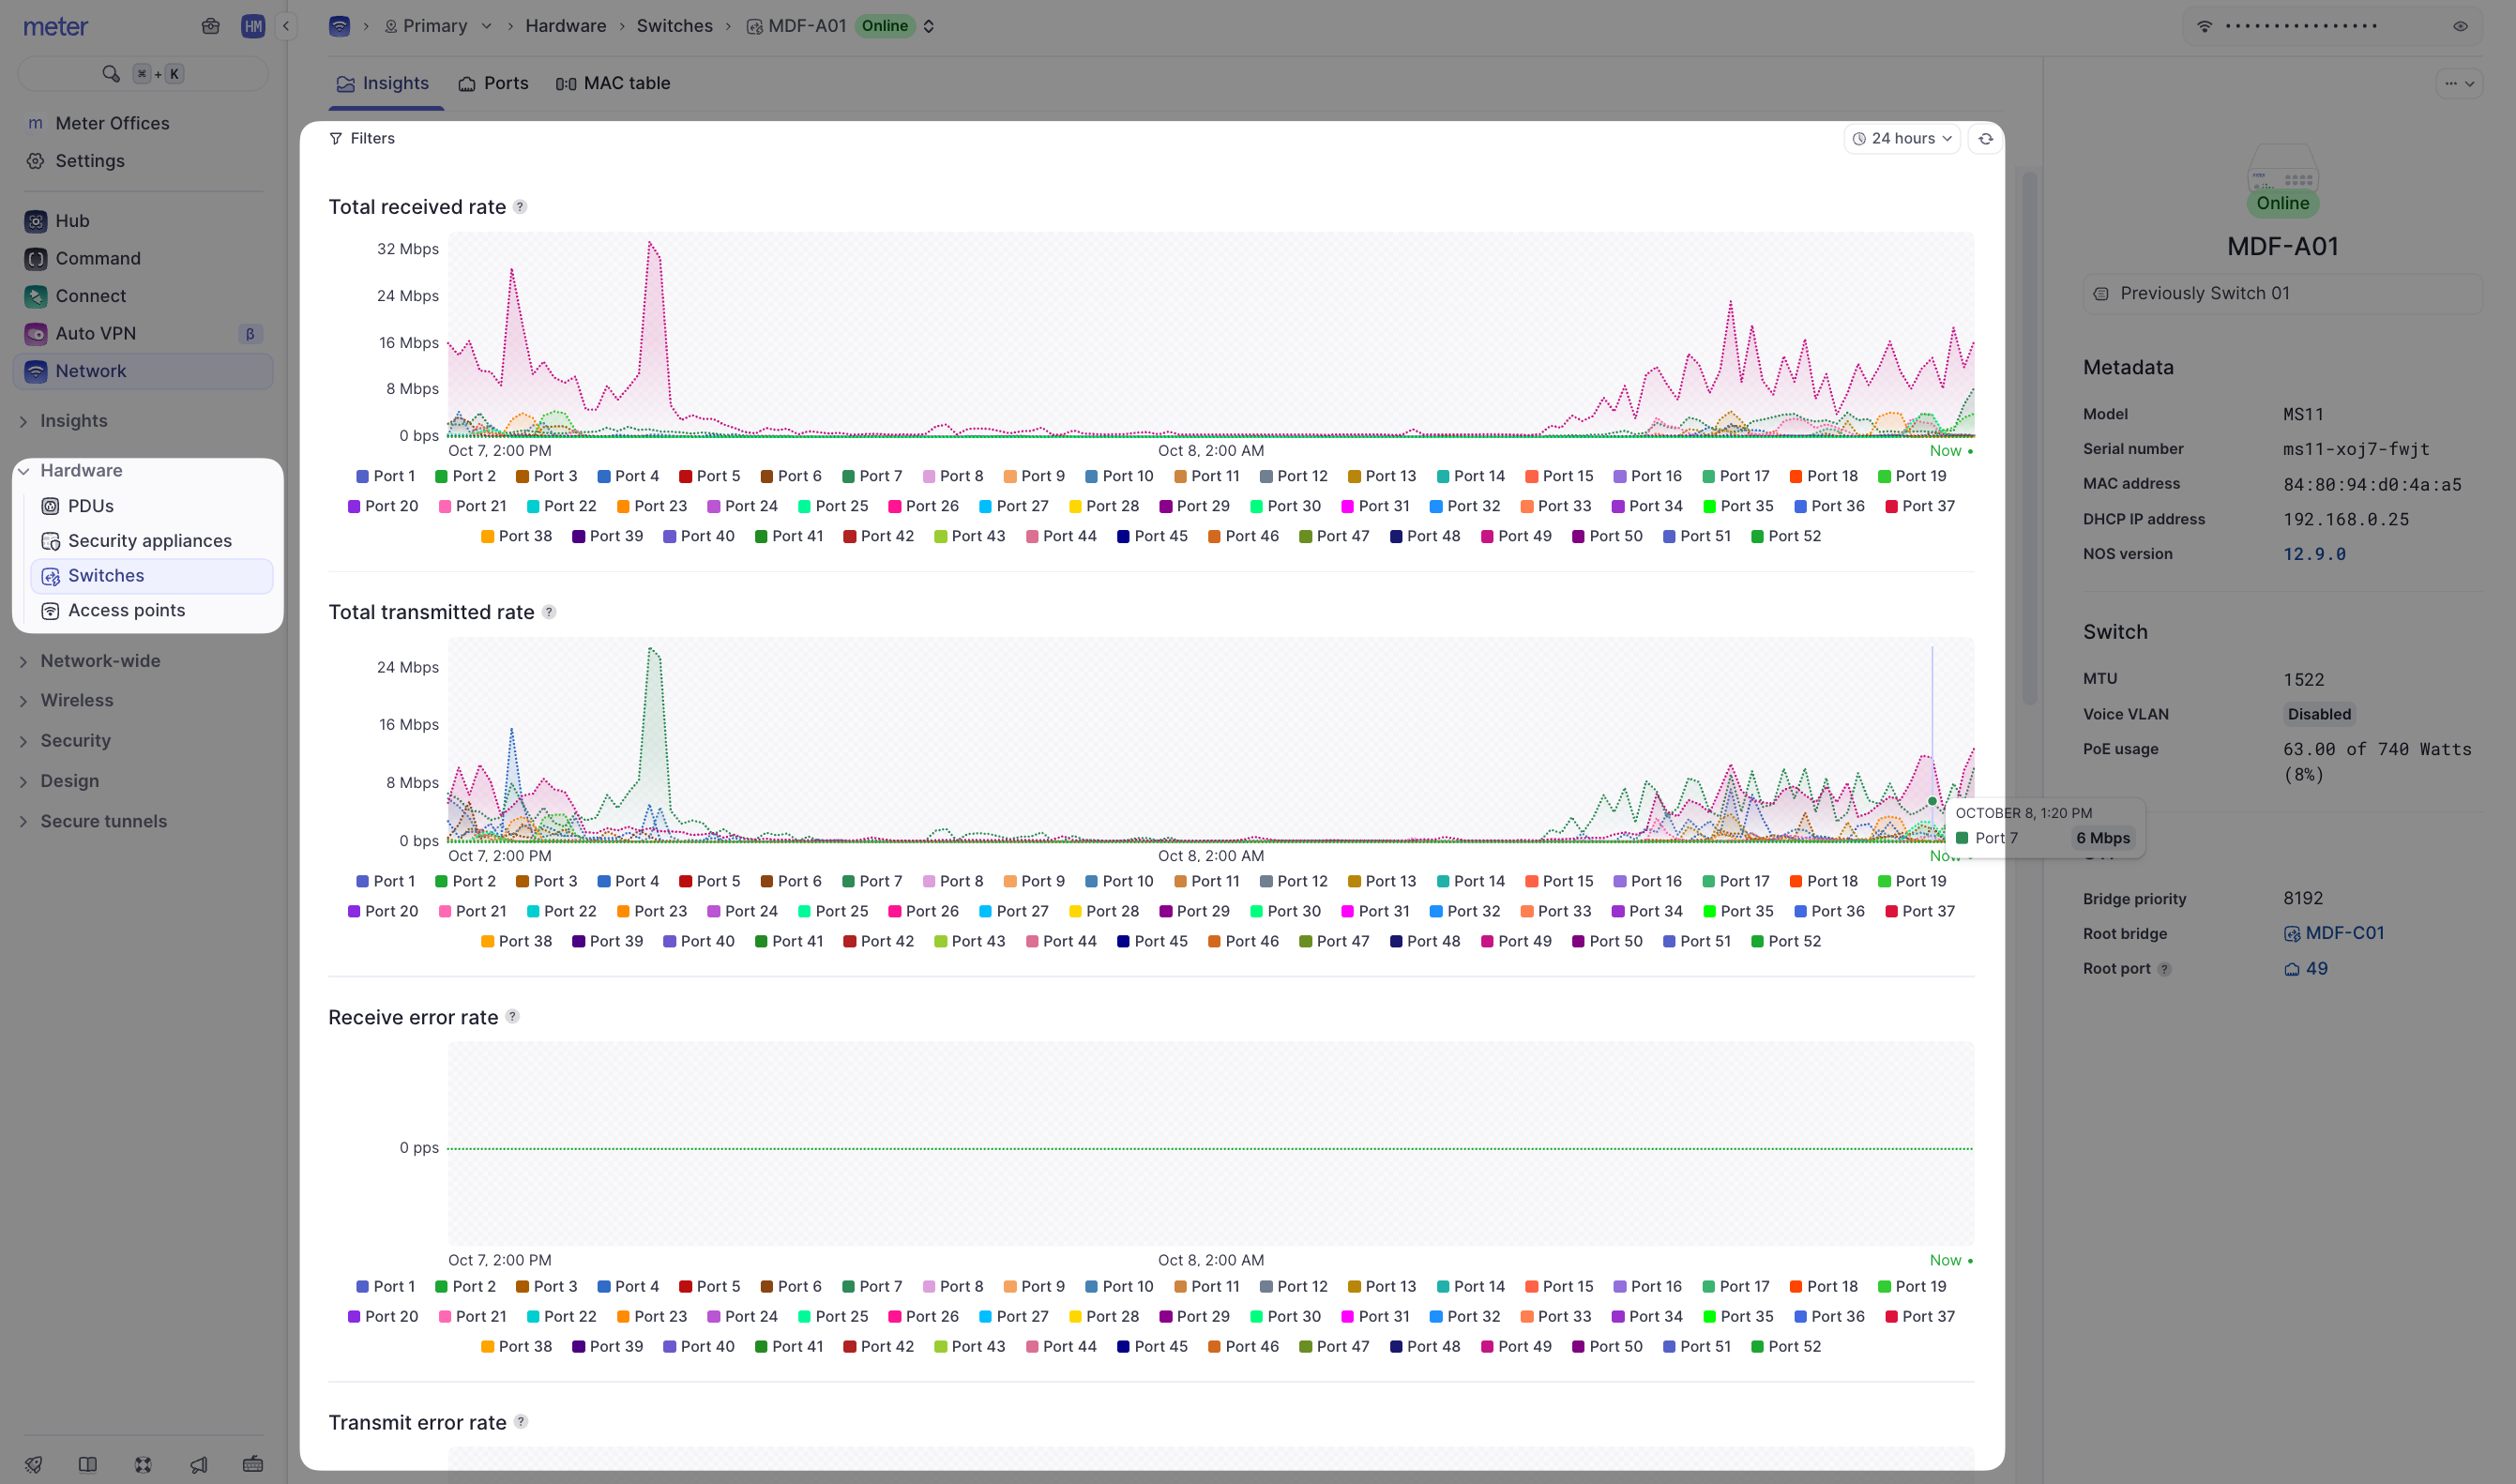
The top-right-hand side of the page contains time and port filters. Individual charts can also be filtered by port by clicking the port number at the bottom of the chart.
Data representation
It is not feasible to send all real-time data to the Dashboard as this would be incredibly resource-intensive. Instead, averages are used depending on your selected time filter:
| Time filter | Data interval |
|---|---|
| Up to 24 hours | 5-minute intervals |
| 24 hours to 30 days | 30-minute intervals |
| 30 days+ | 1-hour intervals |
You may notice data appear to change after selecting different time windows as averages will change for different intervals.
Example
Here is a look at port 7 on a switch, with a 24-hour time filter:

This chart can be read as "between 10:35 and 10:40 AM, the average total received rate was 57 Mbps". Now take a look at this same port with a zoomed out 7-day time filter:
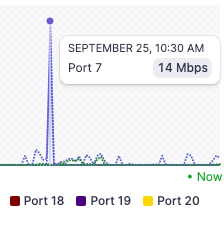
Taking a look at the same spike, this is read as "between 10:00 and 10:30 AM the average total received rate was 14 Mbps". The rate appears to be much lower since it is now an average of the past 30 minutes, instead of the past 5 minutes.
Available metrics
All of the charts on this page use the same type of averaging system. On the Insights page you will find:
| Metric | Description |
|---|---|
| Total received rate | The rate of data received by a port (downloaded) |
| Total transmitted rate | The rate of data transmitted by a port (uploaded) |
| Receive error rate | The number of packets that encountered errors being received in packets per second (PPS) |
| Transmit error rate | The number of packets that encountered errors being transmitted in packets per second (PPS) |
| Receive broadcast rate | The number of broadcast packets in PPS being received on a port |
| Transmit broadcast rate | The number of broadcast packets in PPS being transmitted on a port |
| Receive multicast rate | The number of multicast packets in PPS being received on a port |
| Transmit multicast rate | The number of multicast packets in PPS being transmitted on a port |
Need help?
If you run into any issues or have questions, please reach out to our Support Engineering team by opening a ticket via the Dashboard: https://dashboard.meter.com/support
Last updated by Meter Support Engineering on 01/23/2026